Few events have highlighted the vulnerability of critical infrastructure like Hurricane Katrina, when it struck the Gulf Coast nearly five years ago. Since then, earthquakes, tsunamis, severe weather, wildfires and terrorism have been constant reminders that all critical infrastructure – whether communication, transportation, power, water, health care or dozens of other basic services – is at risk. Earthquakes devastated Haiti and Chile already this year while record snowfalls and storms have pummeled other geographical regions. Wildfire and hurricane seasons repeat annually. Frankly, the odds are against you, so it’s time to even the playing field. Failure to do so can be catastrophically expensive in human, financial and reputational terms.

Mark L. Feldman, PhD
Chief Executive Officer
Space-Time Insight
(Freemont, California USA)
Nowhere is the vulnerability of critical assets more evident than among electric utilities, where sudden and prolonged outages can undermine and significantly set back the commercial, financial and human ecology of entire communities and regions. But, external forces are not the only villains in this scenario. Add aging infrastructure, an aging workforce, systems that don’t talk to each other, proprietary systems that don’t integrate well, systems that cannot differentiate between a security event and a malfunction, and you have a crisis waiting happen. There is more than enough culpability to go around for litigants and regulators.
Utility and ISO emergency operations centers and field teams respond to crises of varying proportions on a nearly daily basis. In the face of natural disasters, they take actions to mitigate the negative impacts on communities and commerce and remediate the damage to their systems and equipment.
For example, these organizations must take timely action to decommission endangered assets and re-route power to lessen the blow from wildfires that can take out critical infrastructure like substations and transmission lines and stop the flow of electric power to cities and hospitals. They must also quickly ascertain the impact of earthquakes, wind, flood waters, and ice storms on assets, employees, and customers.
And, they are responsible for keeping our critical infrastructure up and running, despite earthquakes, hurricanes, floods, and lightning, and they are responsible for keeping the lights on, communications flowing and transport moving for all of us.

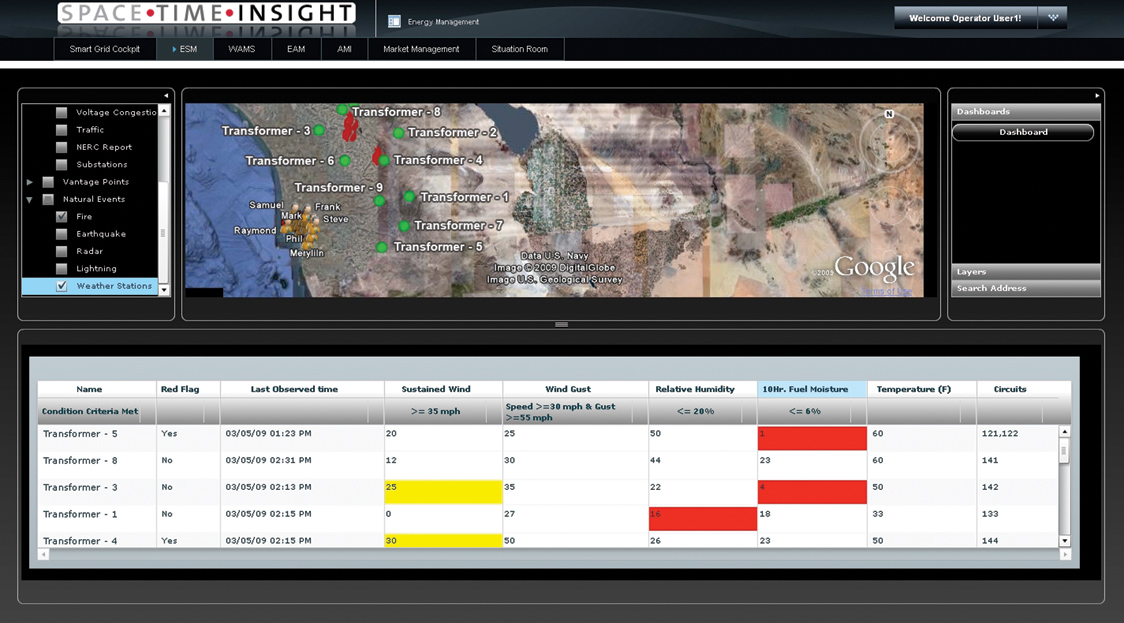
Figure 1: Screenshot of Space-Time Crisis Composite shows geospatial monitoring and alerting about fire locations, fires’ relative priority status, last observed time, wind gusts and direction, relative humidity, fuel moisture levels, temperature, and proximity to critical assets and employees in the field workforce, enabling preventive mitigation and improved emergency response. Control room operators and supervisors can click to details or initiate action flows from the geospatial screen.
Many critical infrastructure companies – energy, utility, telecommunications and transportation companies, and government entities – have access to multi-source geographical information to support effective disaster response. However, the geospatial technology is typically hampered by system constraints and not optimized for time-critical, fully informed disaster response. For example, essential information often resides in data silos that limit the integration, correlation and sharing that might otherwise produce timelier, context-sensitive and informed decisions and more confident actions toward problem resolution.
Some companies have multiple GIS systems with incompatible taxonomies documenting distributed assets in overlapping geographies. Integration of data from these systems is a punishing, manual process that is both time-consuming and frustrating – especially in a crisis. Moreover, it fails to support a unified level of situational awareness. Emergency responders, fire crews, control room and emergency operation center operators, and field service teams often have to manually integrate the information they require as the only way to piece together a complete picture of a given crisis situation.
In many organizations, the flood of data from sensors, enterprise applications, databases, and perhaps weather and other environmental feeds, is still neither integrated nor correlated to deliver the context-sensitive, condition-based information necessary to keep a crisis from becoming a catastrophe. Availability of multi-source data is one thing; making sense of it is quite another.

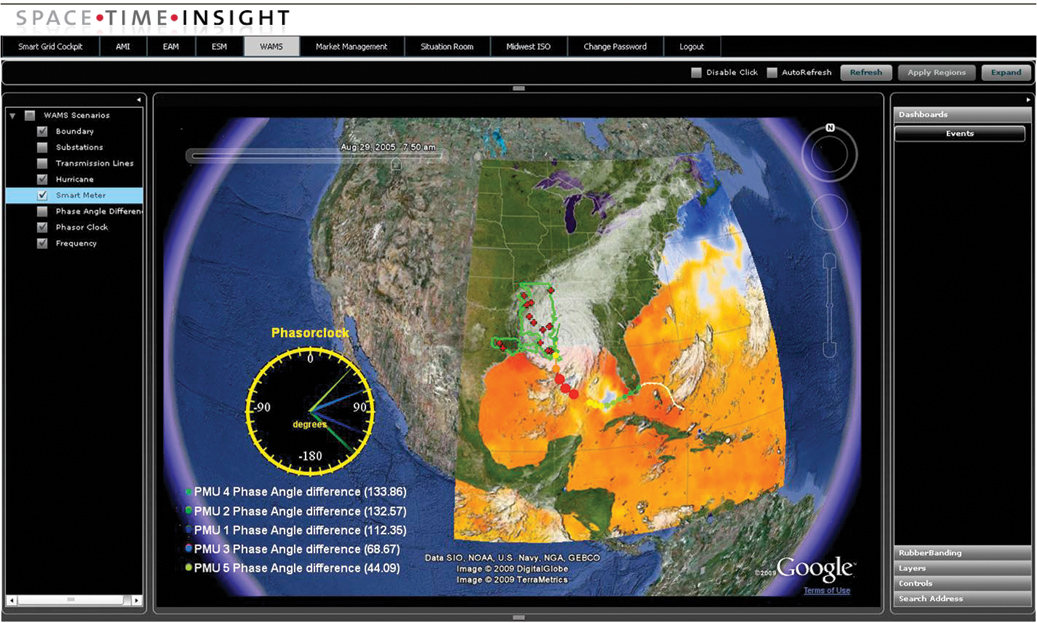
Figure 2: Space-Time Insight screenshot shows historical re-play of a hurricane over a utility’s assets and the hurricane’s impact on grid stability indicators for training and forensic analysis. Simulation features similarly enable scenario planning and training.
Today, organizations that have taken steps to integrate all the data they need in a common, correlated, analyzed and intuitive geospatial view benefit from improved ability to monitor infrastructure in the context of weather as well as other environmental and man-made crisis conditions in real-time. These tools have improved situational awareness, operational efficiency and effectiveness in responding to crises in ways that have been instrumental in preventing power outages, preserving water quality, minimizing disruptions to commerce, reducing destruction of property, and limiting loss of life. In most cases, it is this situational intelligence that provides the advantage they need to counter what is often enormous adversity.
Visually intuitive geospatial analytic solutions can now automatically sense and correlate real-time natural and man-made events such as earthquakes, fires, intense wind, sand accumulation, floods, storms, lightning strikes, explosions, and even unauthorized local activity. These systems can also deliver alerts and calculate both actual and projected impact on rural lands, population centers, and infrastructure. By enabling simultaneous integration of real-time streaming data from sensors, aerial photography, GIS applications, and other enterprise systems, these solutions deliver a level of situational intelligence and range of response that has transformed disaster response.
Interactive screens enable users to drill down for deeper risk analysis and finer detail while also launching remedial actions to initiate prevention, mitigation and remediation of pending and evolving events, while simultaneously recording adherence to established policy, operating practices and regulatory guidelines.
Organizations that can integrate real-time analytics with enterprise data and intuitive geospatial visualization have the data they need to inform better decisions, benefit from early warning, and gain an often critical advantage by having extra time to prepare for and mitigate a situation, thereby limiting its impact and accelerating remediation.
Further, with the addition of full-context, historical playback, users can replay past events on a geospatial screen for audit, forensics, training and planning for faster and more effective responses to future crises.
The geospatial future of disaster response has arrived. With the growing adoption of geospatial visual analytics and remediation software by critical infrastructure companies, the technology is continuing to evolve, incorporating new data sources and evolving with rapid innovation. Here are a few new technology trends.
State-of-the-art geospatial, visual analytics are evolving rapidly into the solution of choice for context-aware situational intelligence. The technology has become simpler and less technical, enabling faster adoption and more widespread use for everything from prediction to preparation, prevention and rapid response. Well-equipped organizations will enable everyone involved in disaster response to access the integrated information they need and collaborate – through browsers and mobile devices. First responders in communities will be able to share data with mobile field crews, and everyone responding to a disaster will be connected and informed and coordinated as never before.
Utilities and ISOs that have already deployed integrated geospatial, visual analytics solutions for disaster response describe impressive benefits. When California ISO accepted a geospatial project of the year award at the DistribuTech Conference in 2008, their executives were quoted saying, “It helped us keep the lights on.” That following year, when San Diego Gas & Electric won the award, their executives stated: “We believe the project will improve our overall ability to respond to – or even avert – potential system emergencies in the future, and help us achieve our mission of providing safe and reliable energy to our customers.”

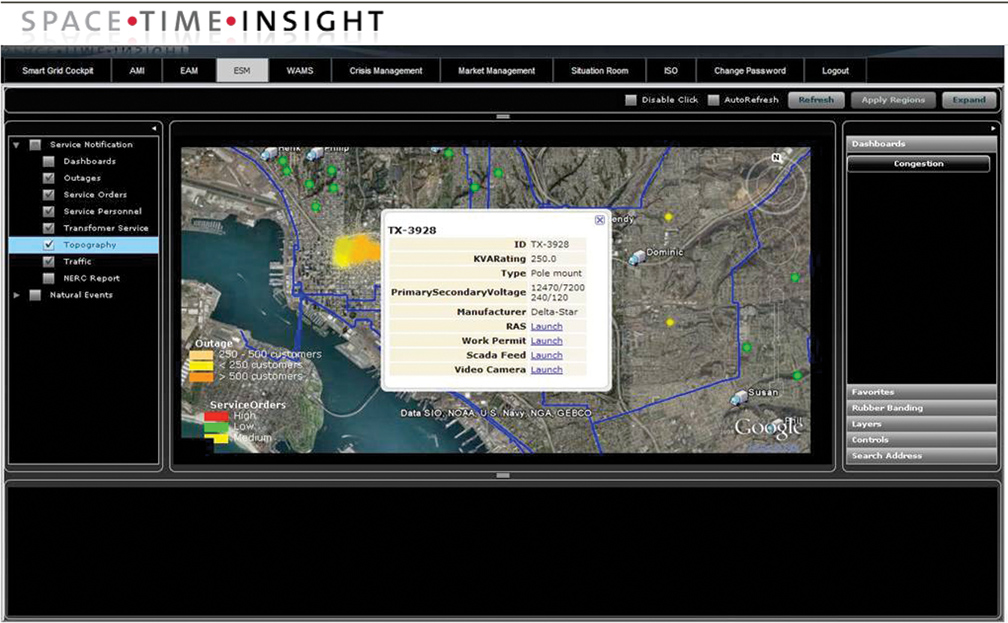
Figure 3: Screenshot of Space-Time Asset Composite shows a pop-up screen, which appears after a user has clicked on an alert within the geospatial screen. The popup offers links to preventive and remedial action scripts and workflows, work permit forms, SCADA feeds, and video footage – enabling more effective resolution of an asset-specific issue.
Currently deployed state-of-the-art geo-links to onscreen action scripts will soon guide a higher percentage of operators through the steps necessary to mitigate and resolve problems before they become catastrophes. Each step will be logged and documented for automated incident reporting and documentation for regulatory compliance, audit, forensics, post-incident analysis and planning. More crisis response workflow processes will be configured based on approved procedures, and local practicalities for quick action in response to crises. This will save critical time and help ensure the most effective actions are taken.
Cloud-based collaboration will soon add even greater value. For example, a community first responder or a member of a field service crew can tap a location image in a smart phone or other mobile device and manually map the location of a wildfire to update the system in real-time with new information. This makes more accurate information available for disaster response, enabling reallocation or redirection of resources or communication of evacuation routes.
Twitter will be increasingly adopted as a real-time tool to aid in disaster response. Twitter’s GeoAPI technology adds geo-signals to Tweets. Control center operators will be able to use the data from Tweet streams to get a better, faster, real-time understanding of what’s happening in the field – seeing where and how people are affected by disaster events and tracking public perception. Disaster responders and utilities are already sending Tweets to the public and their customers to inform them of up-to-the minute updates on the location of an unfolding disaster and the progress of evacuation efforts
and repairs.
Getting a fast, accurate handle on broad public perception will also enable responders to better communicate with the public. Early appropriate action based on good geospatial insight will give disaster responders, government officials, and utility companies enough time to mitigate the public response to a disaster before “crowd psychology” can take a negative turn.
Though natural disasters may appear to be getting worse and increasing in frequency, critical infrastructure companies have more solutions available to address them than ever before and to provide safe and reliable services to their communities, regardless of the circumstances.
About the Author
Mark L. Feldman, PhD (mark@spacetimeinsight.com), is responsible for Space-Time Insight’s strategic direction. Mark was formerly Senior Vice President of Strategy at Virsa Systems and Senior Vice President in the Product & Technology Group at SAP Labs. A frequently quoted speaker, Mark has addressed audiences throughout the world on industry transforming events.


