In my previous article, “Intelligent Line Sensor Projects: How to get your grid modernization efforts off the ground,” I provided several steps to help utilities get their line sensing pilot projects rolling.
Here, I’ll provide guidance on how to take the next step: proving ROI from your line sensing pilot project. I’ll include recommendations on how to reprioritize investment areas to achieve more value so you can confidently implement line sensing on a wider scale.
Where to begin: Determining ROI value streams
Traditionally, utilities have looked to line sensors to help improve overall reliability and prove the value with SAIDI reductions. However, today, advanced analytics leveraging high-fidelity data from intelligent line sensing offers utilities the opportunity to address multiple power delivery challenges, resulting in simultaneous returns on investment (ROI) and a variety of grid reliability use cases.
Value Stream #1 — Predict and preempt outages with advanced analytics
One of the most innovative uses of line sensor data is to predict and preempt outages. By adding analytics and machine learning to high-fidelity sensor data, utilities position themselves not only to execute proactive maintenance; but also, can identify potential risks for wildfire ignition.
To detect possible system problems before faults and thus outages occur, analytics modules must be deployed. It is recommended to leverage the power of the cloud due to the large amount of data collected and the computing resources required for machine learning. To maximize the ROI of this value stream, line sensor data integration software must also be flexible enough to integrate with cloud components.
Anomaly data is typically collected for several months to establish a baseline and predict outages. Line sensors detect waveform anomalies and machine learning algorithms identify precursors to faults caused by vegetation contact with power lines, as well as equipment failure. Daily reports alert utility companies to feeder segments experiencing high levels of precursor anomalies so they can take preemptive action.
While vegetation management is not new to utilities, using a data-driven workflow based on analytics and line sensor anomalies to predict faults associated with vegetation and line contact is an innovative approach. By proactively addressing these faults before they cause larger issues, utilities can significantly reduce wildfire risk and the costs associated with vegetation management.

Image credit: Sentient Energy
Machine learning is also effective in characterizing anomalies that are precursors to equipment failures of insulators, cutouts, lightning arrestors, transformers and other components. Line sensing, data integration and analytics provide clear indicators of impending equipment failure, allowing utilities to prevent unplanned outages by taking preemptive action.
Preempting outages due to vegetation contact and equipment failure provides significant improvements in the system average interruption frequency index (SAIFI), leading to considerable O&M savings. By preventing future outages, utilities can also improve long-term system average interruption duration index (SAIDI) metrics.
Value Stream #2 — Reduce outage durations with fault detection and location
To achieve enhanced fault detection and reduced outage durations, overhead and underground line sensors provide utilities with enhanced system visibility along feeders and laterals. With remote communications, these intelligent sensors are often deployed on overhead lines, underground cables, pad-mounted or vault switches and underground residential (URD) transformers.
Regardless of where you installed sensors for your pilot project, having a more detailed view of the system gives you the ability to narrow down patrol areas and equip crews with better information to address faults swiftly. By integrating data from line sensors, you can improve reliability metrics such as outage durations, system average interruption duration index (SAIDI) and operations and maintenance (O&M) costs.
Line sensors assist utilities in detecting and locating faults, resulting in reduced outage durations on affected feeders and laterals. The integrated use of sensor data with supervisory control and data acquisition (SCADA) or ADMS applications increases the value of sensor data, creating a fast time-to-value.
Though you’ll need to assess your own specific ROI, you can anticipate that you’ll likely see improvements of 20% or more in Customer Minutes Interrupted (CMI) on feeders with line sensing deployments. This improvement is primarily due to significant reductions in patrol time, with some utilities reporting savings of up to 65% in patrol time. Reducing patrol time also leads to operations and maintenance (O&M) cost savings, with one large utility in the southeastern region reporting an 11% reduction in O&M costs due to line sensing initiatives.
Value Stream #3 — Plan for new distributed energy sources with load monitoring for enhanced system planning
When it comes to system planning, having accurate load data is crucial for making effective decisions. However, system planning teams often lack load data for the specific locations of interest, which can hinder their planning efforts. Intelligent line sensors offer a solution by providing visibility of system load at additional points on the grid, filling in these data gaps.
This is particularly important as power networks incorporate distributed energy resources (DERs) and electric vehicles (EVs), which introduce significant changes to historic load curves and make load forecasting more complex. Relying solely on load data from the substation is no longer sufficient.
In addition to load monitoring, line sensors installed on underground residential distribution transformers can also detect faults on the primary side and monitor transformer loading. This information aids utility engineers in improving asset management by using real system data to identify overloaded assets before they fail. With the increasing prevalence of electric vehicle charging, monitoring transformer loading becomes even more crucial, as a transformer that was previously appropriately loaded may become overloaded when multiple customers charge their EVs simultaneously.
Line sensor load data is available within minutes of sensor installation. You should be able to immediately integrate the data-driven insights into your decision-making processes and workflows for tracking ROI. You should anticipate that identifying and replacing overloaded transformers as part of planned equipment upgrades can result in savings in CMI and O&M costs, improve customer satisfaction and reduce the risk associated with wildfire ignition.
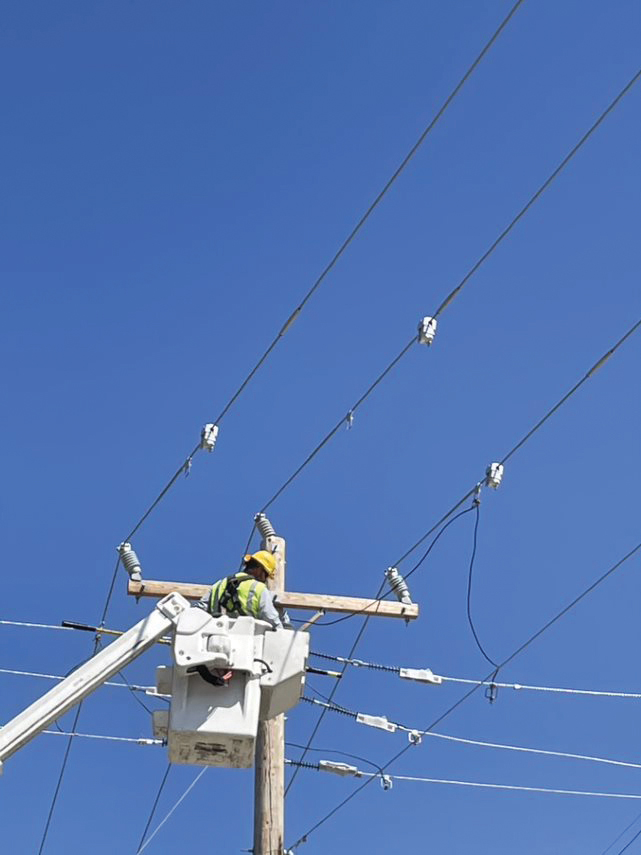
Image credit: Sentient Energy
How to crunch your numbers
When considering ROI, it’s rather straightforward to simply add up the costs of the pilot in terms of sensor hardware, software and any other costs for deployment and ongoing management. It’s a little more difficult to calculate ROI in terms of the payback or value to the utility derived from the pilot.
The approach to calculating value derived is different for each of the three value streams. The most straightforward way to determine value to the utility is calculated in Value Stream #2 — Reduce outage durations with fault detection and location.
In Value Stream #2, we can estimate value with either reduced customer minutes interrupted (CMI) or reduced O&M costs. To do this, we focus on faults that occur during the pilot and compare the resulting outage duration to that of the historic outage duration times for the same feeders. Utilities typically see a 20% reduction in outage duration by adding line sensing technology. Here’s a sample calculation:
Outage Duration: 140 min
Historic Duration: 175 min
Number of Customers Impacted: 400
Utility’s CMI Value: $1.20
CMI savings calculation:
With this scenario, we take the CMI savings of 35 minutes (historic outage duration minus pilot outage duration) and multiply it by 400 (the number of impacted customers). This gives us a total CMI of 14,000.
Then, we multiply 14,000 (the total CMI) by $1.20 (the amount the utility values CMI). This defines total savings for this one outage at $16,800.
O&M reduction savings
If O&M costs are preferred to CMI, we again start with the 35 minutes saved but this time multiply it by the cost of the crew. Let’s say the crew cost with a vehicle is $1,000/hour, then the O&M savings will be $583.
When calculating ROI for Value Stream #1 — Predict and preempt outages with advanced analytics, we are estimating CMI and O&M savings based on an outage that didn’t occur. We use the same formula to determine derived value as above. For example, if by predicting and preempting an outage on a feeder with 650 customers and a typical outage duration of 120 minutes, the “avoided CMI” would be 78,000, or at $1.2/CMI, $93,600. The “avoided O&M costs” would be for 120 minutes, or at $1K per hour, $2,000.
In addition, predicting and preempting outages also creates “unrealized” ROI for utilities. This happens when there is an opportunity of potential savings by acting on predictions more quickly. Let’s say a prediction is made that there is a potential fault indicative of equipment failure. However, a repair could not be made before the fault and thus, an outage occurred. By tracking unrealized value, the utility has an idea of the potential savings if predictions are acted on more quickly. In this case, the CMI and O&M cost associated with the outage predicted but not preempted would be considered “unrealized value”.
For Value Stream #3 — Plan for new distributed energy sources with load monitoring for enhanced system planning, ROI is determined by quantifying the value of improving network load flow models by leveraging intelligent line sensors. Theoretically, accurate load flow models enable switching decisions which makes restoration more efficient. By comparing SAIDI numbers before and after adding line sensors, it would be possible to quantify more effective switching. For example, a fault was isolated, and part of the circuit was powered from a different feeder through switching. This switching operation restored 300 customers and a 120-minute outage was avoided. The CMI saved due to the switching operation was 36,000 at a value of $43,200.
Final thoughts
Like any experiment, it’s best to start with a specific problem to solve, so begin with the primary use case or value stream for the line sensing pilot. From there, you can calculate CMI and O&M reductions based on reduced outage durations, faults avoided, or restorations enabled by effective switching decisions. Line sensing solutions are quickly deployed on the feeders and laterals and provide actionable data minutes after installation. No matter how the utility calculates ROI payback, either CMI or O&M savings (or both), crunch the numbers and you’ll see the line sensing provides fast time to value compared to other reliability projects.

Randy Cough has more than 30 years of electric distribution operations & planning and program management experience relating to grid modernization programs for electric utility customers. His primary expertise is in utility control center operations, distribution automation and control center applications such as advanced distribution management systems (ADMS) Outage Management Systems (OMS).
Prior to joining Sentient Energy, Cough worked at GE Energy for 20 years. His experience also includes more than 15 years at Niagara Mohawk Power (now National Grid) as a system electric operations director.