Abstract
Managing On Load Tap Changer (OLTC) fleet depends on the assessment of their condition. In addition to the insulation condition, dynamic performance characteristic is the most important factor defining suitability for operation. The Dynamic Recording and Measurement (DRM) is a new off-line test technique showing its diagnostic power in detecting OLTC operational problems. A graph of a test current is analyzed where mechanical motion issues and contact bouncing, coking or wear is detected. Multiple tap changers on the same drive can be checked for synchronization in operation. Such insightful tests have not been possible prior to this new tool.
Introduction
The asset manager’s task is to define the suitability of each apparatus for normal operation and review the risk of putting a compromised asset, such as a transformer in service. The only moving part in a power transformer, the On Load Tap Changer is one of the main contributors to the failure rates of high voltage power transformers. The OLTC principle was patented in 1927 by Dr. Bernhard Jansen and its premise was very simple: “make before break”, or connect with the next tap before breaking with the previous one. This is still true today, and tap changers are designed following this approach. As this is a tap changer that operates under a transformer full load condition, the circuit should never be broken. Thus, opening the circuit is one of the biggest OLTC problems. It creates gases and can cause transformer tripping or even a failure. Detecting this was impossible using old-fashioned static measurement techniques, as the process of transition lasts only a fraction of a second.
The AMforum association has created a working group to investigate and standardize the methodology, and some cases collected over the years are presented here. The IEEE transformer committee, through the performance characteristics subcommittee, just created a task force to standardize this method. The IEC and IEEE are coming out with a joint OLTC user guide including this test.
OLTC
A utility population of tap changers may contain many different designs and principles of OLTC operation. They can be in the tank or in a separate compartment attached to the tank. They can use reactors (preventive autotransformer - PA) or resistors in their operation to lower the circulating current during the transition. The switching can be in oil or contained in the vacuum bottles. For high currents, a booster or a series transformer may be added to lower the current while increasing the voltage the OLTC deals with. The current switching and selection of taps can be performed using the same pair of contacts (arcing tap switch), or using two sets of contacts (a selector, and a separate transfer or diverter switch). Then, two or three tap changers can operate on the same mechanism in one transformer and their synchronization needs to be verified. Many variations require the knowledge of exact tap changer type in order to analyze test results.
Reactor OLTC
The reactor type tap changers are predominant in the USA networks, while European tap changers use resistors for circulating current limitation during the tap transition. These reactor OLTC constructions rely on Preventive Autotransformers (PA) to limit this current and provide double the number of tap positions, compared with resistor ones, for the same number of taps brought-out from the regulating winding. The PA is a gapped core reactor with dual windings, wound in opposite directions; in fact an additional small transformer inside the main transformer tank. As the PA does not permit the current to circulate, a bridging position is allowed with reactor OLTC indefinitely.
Test Methods for OLTC Condition Assessment
Various tools exist where OLTC can be visually observed or scanned using thermography. Dissolved gas can be used as a tool to find a problem with excessive heating or arcing. These tests can indicate the existence of a problem. The turns ratio can be measured on each tap, and winding resistance for all taps test results should be consistent. Vibration methods look into signatures collected using vibro-acoustic sensors or accelerometers. Monitoring various on-line parameters can provide an indication of torque, mechanical issues, overcurrent, overheating, etc. The possibility for the test crew to see the problem off-line, if any with OLTC operation was, based in the past on flicker in the test voltage, or induced voltage when performing some AC tests, like turns ratio while operating the tap changer. Many times OLTC was open on these indications and nothing unusual could be observed.
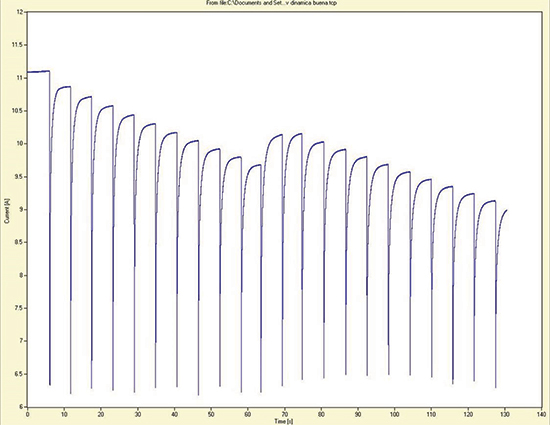
Figure 1. Graph of a good resistor type OLTC
The Dynamic Recording and Measurement
With modern electronics, the recording of a test current at high frequency allowed us to see the performance of an OLTC at high speed, providing asset managers the important information of its mechanical motion, and contact bouncing, opening, coking etc. The same test set can measure traditional contact resistance as well, plus demagnetize a core which was magnetized by the DC current applied during this test or other magnetization causes. The DRM methodology is only 10- to 15 years old, but it has shown a great potential in detecting problems otherwise invisible to repair technicians. The benefit of this method is the simplicity of analysis - it does not require great experience when viewing the graph. When the applied DC test current is stable, it creates a straight horizontal line on a time graph. Any increase in resistance or reactance makes the current drop, visible as a dip on the graph. Any resistance drop makes the current jump, as with lowering the number of turns the current will go up. A good tap changer makes the graph very smooth and any discrepancy indicates a problem. Figure 1 shows a good DRM graph of a resistor tap changer. Figure 2 is a graph of a brand new reactor tap changer. These graphs provide benchmarks, so when the tap changer is new, a fingerprint of its operation should serve as a base for comparison during the maintenance periods.
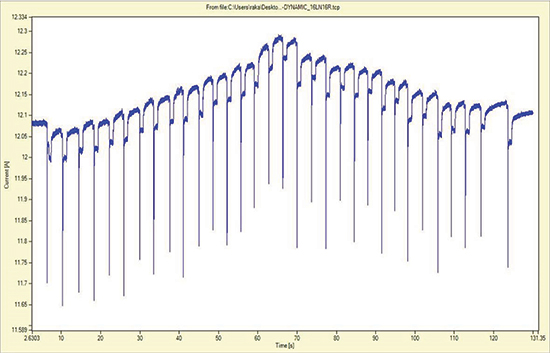
Figure 2. Graph of a good reactor type OLTC
The DRM test lead connection is identical to the transformer winding resistance measurement, and the instrument is usually the same. In fact, both can be obtained in the same process; the first one sometimes called static resistance, as opposed to this “dynamic resistance” graph.
Each tap changer transition during this DRM test creates a “dip” in the current graph. These dips are called ripples and we analyze values and shapes of the ripple for each transition. The ripple value is expressed in percentages, and they all should be consistent. A ripple value of 100 percent, or close to that, is an indication of the circuit opening, and as we said before, this is not acceptable for normal OLTC operation. For resistor type tap changers ripples are very consistent, while for the reactor types, ripples alternate – longer and shorter, for bridging and non-bridging position transitions.
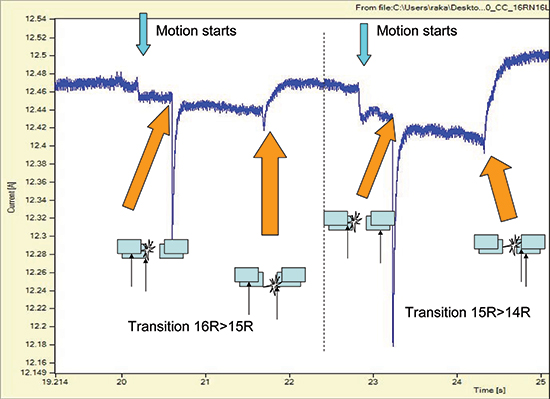
Figure 3. Key features of a reactance graph –two transitions shown
The current trace in the graph of Figure 3 shows the key points of a good GE type LRT200 tap changer operation. Events are identified by these sudden current changes. Six key feature points are visible in this graph that represents two transitions of OLTC: from non-bridging to bridging, and then from bridging to non-bridging positions (in this example: from 16R to 15R, then 15R to 14R).
Synchronization
Multiple OLTC operation coordination needs to be checked, and the synchronization mode is used – where all three phases are tested together. When located in the delta winding, tap changers at higher voltages need to be isolated from each other. Thus, two or even three separate tap changers are operated from the same motor and mechanical drive. The connection for YN configuration is with three parallel phases, where for Delta winding, they are tested two by two. Figure 4 shows a synchronization graph of a YN configuration, where one phase is leading the other two by a significant 100msec difference. While this difference is not crucial, any change and increase over time may indicate a deterioration of the mechanical gear connection, and potential failure in the future.
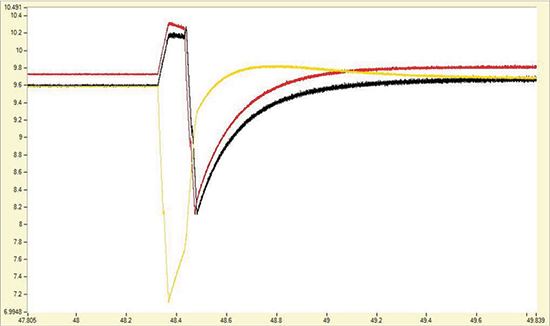
Figure 4. Graph of a three-phase synchronization test
Cases
Simple problems, which may lead to a major failure if detected early, can save a lot of problems and money for the operator, finding the defect early and requiring an easy fix to rectify it. The AMforum is a European association of asset managers in electric utilities. We have looked into this test method at our previous meetings and decided to form a working group to define the procedure and standard method of evaluating test results. The group collected a large number of test graphs from all over the world with the focus on the USA and some interesting cases are shown here.
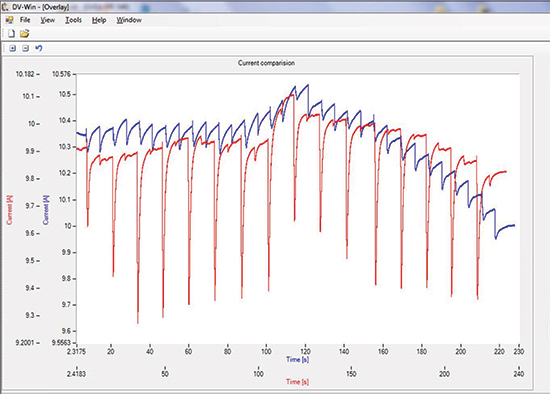
Figure 5. Overlay of two test graphs, good and bad
On Load Tap Changer model 546 manufactured by Federal Pacific Electric is an older type and prone to various problems. This particular one exhibited a significant difference in the ripple value for the phases X2 compared to X1 and X3. Figure 5 shows an overlay of two graphs – phase X2 shown in red and X1 in blue. This difference was significant enough to prompt a corrective action including draining the oil and opening the OLTC tank. Upon investigation, it was found that the bolt for the feed on phase X2 from the transformer to the collector ring had vibrated loose. The maintenance personnel cleaned and retightened the bolt. Once the transformer was repaired and ready for service a retest was performed to verify that corrective action was successful. Ripple values were normal and compared favorably with the other two phases. This simple and timely correction saved a major problem that could have developed if the bolt was left loose, creating overheating and arcing.
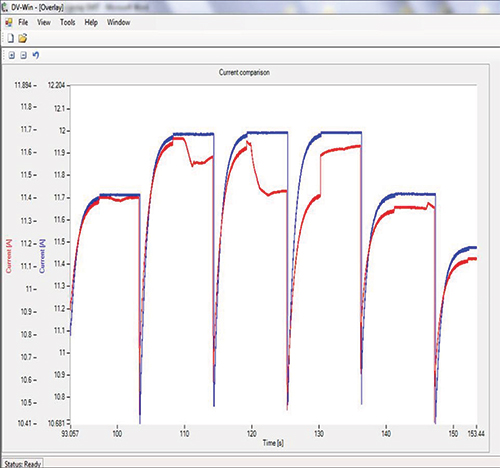
Figure 6. Overlay of two graphs, good and bad
One diagnostic tool, the DGA, indicated an increased concentration of gasses in a VRC type tap changer. Finding a source of this would have been impossible without the dynamic record. Here a reversal switch connection was found loose. Figure 6 shows a correlation of two phases, the good one in blue and bad one in red. It is clearly visible that the red current trace is not a straight line during the stable period of tap changer idling at the neutral position. The wiggly trace is pointing to a bad contact or connection, in this case, the K (+/-) contact. The photo in Figure 7 shows the exact position of the loose bolt that was tightened very easily using the manhole at the selector.
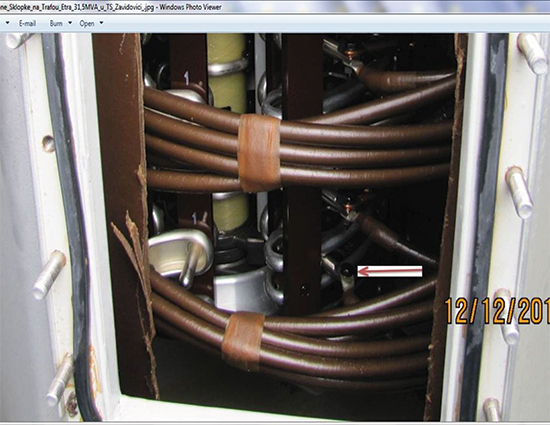
Figure 7. View of the selector through the manhole, loose bolt indicated
The graph in Figure 8 proves an important point that the procedure has to be followed exactly. The two traces were recorded when a reactor type tap changer was switching from one position to the next, first in one direction and then in the other direction. It is almost a mirror image of the transitions. For that reason a standardized procedure should be defined: Perform the test always in the same direction – either from 16L to 16R, or opposite. Even better, if the tests were performed in both directions, the various switches are investigated in their action regardless of the tap changer direction.
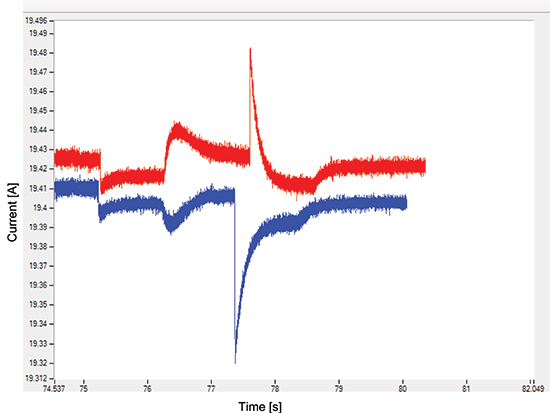
Figure 8. Two transitions recorded in opposite directions
Conclusion
Asset managers now have a new tool to investigate dynamic performance of an OLTC. It provides a direct assessment of its condition and suitability to perform its intended function, and that is to allow transformer regulation to operate uninterrupted in a full load condition. Dynamic Recording and Measurement gives a very simple graph to evaluate and indicates any troublesome component in the complex moving mechanism such as an OLTC. The benefit is defining exactly which component is defective, so an early spare part request can be made before the repair. This test can be done with oil still in the OLTC compartment, thereby reducing manpower and out of service hours, or it can be done on a drained compartment. This reduces costs of inspections for the asset management and maintenance teams. Mechanism defects or maladjustments were detected; contact bouncing and coking were found. Spring breaking, transfer switch loosening, loose bolts and circuit opening are some of the problems detected. More importantly, the result analysis defines which phase and which switches were defective. The beauty of the method is the ease at which analysis is visually performed, and no high expertise is required to observe a problem when evaluating the DRM graphs. Asset management can use this on suspect OLTCs, regularly scheduled maintenance, or on new asset acceptance, which provides a footprint for later testing comparisons.
About the Author
 Dr. Raka Levi is an application expert at DV-Power Sweden and convener of the AMforum association. He has more than 30 years of asset performance and condition assessment experience, specializing in apparatus testing, monitoring, and diagnostics. Levi is a vice chairman of the IEEE Task force for LTC field-testing guide. Seven years ago he started within the AMforum organization a working group on DRM test methodology for tap changers. For 20 years, he has been running committees that assemble asset managers, organizing AMforum conferences in Europe, LTC Universities in the USA, and LTC Colleges in Asia. His education includes a Ph.D. in the field of HV apparatus diagnostics, and an ME in electric power from the RPI, New York.


