

Abstract
Moisture content of solid insulation is a concern for power transformers as it causes several detrimental effects on the insulation’s integrity. Moisture content assessment is often derived from an oil sample submitted to a Karl Fischer test in laboratory, although it is recognized that a single sampling cannot reveal the moisture content in paper if the oil temperature is unstable. On-line monitoring systems are available and continuous recording allows integration of temperature variations and the computation of a dependable value for moisture content in paper. Collection of data over a long period allows calculation of moisture content of various components of the solid insulation system even if they are at different temperatures and characterized by different diffusion rates.
1. Introduction
Moisture management in power transformers is a concern. Extensive drying procedures are applied at the manufacturing stage and sustained efforts are deployed in service to maintain high dryness. At high temperatures, the residual moisture in winding insulation can trigger the release of free gas bubbles, creating an immediate threat to the dielectric integrity of the insulation structure.
In the recent IEEE Std C57.106 – 2002 (2)the permissible moisture level in paper is inferred from values of water content in oil, assuming thermal stability and moisture equilibrium between paper and oil:
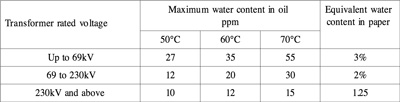
The traditional method calls for oil sampling at regular intervals. It is then processed through a Karl Fischer titration method that provides the total water content in oil in parts per million (ppm). Most of the water is in the form of dissolved water and available to move from oil to the solid insulation as the transformer progresses toward equilibrium. Some of the measured water is chemically bound to chemical agents such as by-products of oxidation. This bound water is only partially available to migrate from the oil to the paper. Some of the water may also bind to particles in suspension in oil and this water would not be fully available to move to the solid insulation. In spite of these constraints, this method remains the most commonly used to assess the moisture content of solid insulation. Equilibrium curves have been developed to relate absolute water content in oil to water content in paper (Figure 1). Application of these curves implies that the transformeris under a thermal equilibrium.
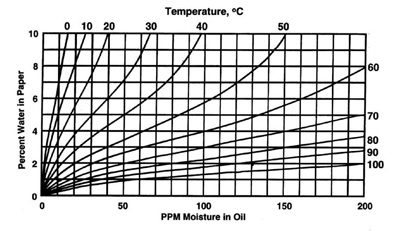
Equilibrium Curves for Moisture Partition Between Oil and Paper
(ppm vs. WCP)(3)
Measuring relative moisture saturation (RH %) makes it unnecessary to consider the type or condition of the oil. The relative saturation is the percentage of full saturation and is the most representative figure of the water available in oil for transfer to paper. At equilibrium, relative saturations of both components of the insulation system (oil and paper) are equal. Commercial on-line moisture monitoring sensors usually provide a relative saturation measurement as well as the measurement of the oil temperature at the location of the moisture sensor. From these two measurements,the relative saturation can be converted in absolute water content in oil in ppm (WCO). At equilibrium,relative saturation of oil is the same asrelative saturation of paper in contact with the oil. In this condition, the equilibrium curve relating water in oil to water in paper (Figure 2) can be applied to determine the water content of paper (WCP).
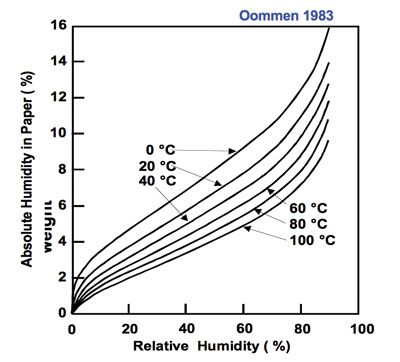
Equilibrium Curve for Moisture Partition Between Oil and Paper
(RH % vs.-- WCP)(4)
2. Water Distribution Under Steady Thermal Conditions
In normal operation, even though a stable thermal condition can be created, there still are temperature differences and therefore different moisture contents in the various parts of the insulation structure.
For example, we may consider a naturally cooled transformer with a temperature drop of 20 °C between top oil and bottom oil at full load. Assuming an ambient temperature of 20°C and thermal equilibrium,the temperatures shown in Figure 3 for oil and winding are typical. If a moisture sensor, installed at the bottom oil temperature, shows a relative saturation of 22%, we can deduce from the equilibrium curves in Figure 2, the moisture content indicated in Figure 3, for the different parts of insulation. These different moisture levels need to be considered in the condition assessment of transformer insulation.
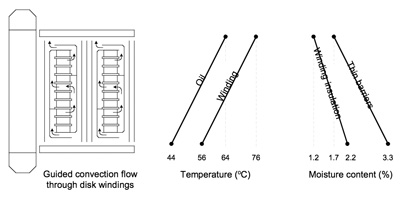
Figure 3: Moisture Content on Critical Insulation
3. Water Distribution Under Transient Thermal Conditions
In practice, thermal stability conditions are never achieved. Beside load variations, the transformer is submitted to daily and seasonal temperature variations. With temperature conditions continuously varying,equilibrium curves cannot be applied directly; therefore it is not possible to assess correctly water content of insulating paper from a single sampling of insulating oil and a Karl Fischer test in laboratory, even if oil temperature is noted at time of sampling.
Temperature changes entail displacement of water from paper to oil or vice versa. The diffusion rate for this process depends on the temperature and on the thickness of solid insulation, on the area of contact between circulating oil and paper and on moisture content of paper. Diffusion time constants reported in literature for thin insulation (1 mm) are summarized in Table 2.
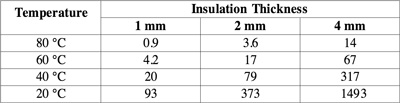
Table 2: Diffusion Time Constant for Oil-Impregnated Pressboard Insulation
(in Days)
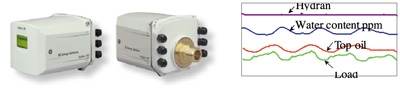
Figure 4: HYDRAN M2 Sensor With Display of Typical Recorded Data
These slow diffusion rates make it necessary to average recorded data over a long period. The averaging period has to be adjusted according to oil temperature and thickness of the insulation to be assessed. This is best done with on-line monitoring providing data acquisition of moisture in oil and relevant temperatures.
4. On-Line Monitoring of Moisture Content in Transformer Insulation
Several on-line monitoring systems are available to record variations of moisture content in insulating oil. The concern over moisture content in paper might not warrant deployment of expensive monitoring systems over a large population of transformers. An interesting solution is to combine real-time moisture in oil measurement with a more essential monitoring function such as real-time detection of fault gases dissolved in oil. This is the avenue selected for the HYDRAN* M2 that combines two functions. The first is detection of incipient fault in transformer insulation. On-line monitoring of hydrogen and CO has been recognized as an excellent method for detection of dielectric and thermal problems. Detection at an early stage is the best means of reducing the risk of failures and forced outages. A moisture detector is also available, which is a thin-film capacitive sensor that is sensitive to relative saturation. The RH % reading can then be converted to absolute moisture content in ppm. Configurable analog inputs are provided for recording significant parameters such as top oil temperature, bottom oil temperature and load.
Figure 4: HYDRAN M2 Sensor With Display of Typical Recorded Data
With such a device, it is possible to record data over a long period. This data can be processed with a suitable algorithm that takes into account the variations of winding and oil temperature on the dynamic process of water migration.
Relative saturation needs to be recorded with oil temperature at the sensor. Top and bottom oil can be recorded along with load to determine the temperature in the insulation components. This data is averaged over time to account for slow diffusion rate involved in migration of water between paper and oil. 5.
Field Data
In August 2003, a 50 MVA, 230 kV transformer was equipped with a HYDRAN M2 sensor and a continuous string of data was made available from the data logging function for off-line processing. It is an old unit, core type,55°C rise with a nitrogen blanket. The sensor is mounted on a spare cooler outlet at the bottom of the tank between two sets of coolers.
Figure 5 shows one week of data where daily variation of moisture content in oil is visible along with relative saturation and top oil temperature. Since thermal conditions are continuously changing, it is impossible from a single measurement to assesswater content in insulating paper. Depending on sampling time, the computed value of water content in paper at top oil temperature could give any value from 1.3 % to 2.5 %, almost a two-to-one variation. If this data is recorded over a long period, it is possible to determine moisture content of various components of the insulating system taking into account physical characteristics of solid insulation, diffusion rate and temperature.
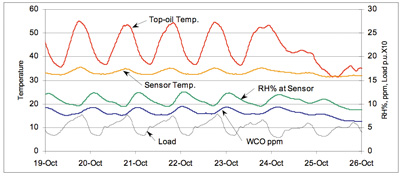
Figure 5: Data Logging for One Week in October 2003
Figure 6 shows the main data recorded from September 2003 to March 2004. Loading is fairly stable between 0.5 p.u. in fall to 0.4 p.u. in winter. The transformer is running cold with top oil temperature ranging from about 45°C infall to 25°C in winter. Usingtop oil temperature, load and transformer characteristics, it is possible to calculate bottom oil temperature and hot-spot temperature. Daily variations have been filtered out from these data to better show long-term trends.
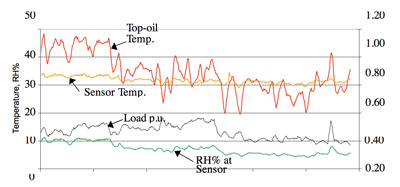
Figure 6: Data Logging Over a Period of Three Months
The insulation structure is made of several components that need to be evaluated separately in terms of moisture content. The first component is the winding insulation paper because moisture content has a direct influence on insulation aging and on the probability of releasing bubbles should an overload occur. This component is fairly thin and experimental evidence has shown that in regard to diffusion rate, disk winding can be assimilated to a 1-mm paper(6). As can be seen in Figure 7, the average hot-spot temperature over the first month of data logging, is about 50°C leading to a diffusion time constant of approximately nine days. As hot-spot temperature drops, diffusion time constant rises to reach above 60 days in some cold winter periods.
The second component is the thin barriers providing main insulation between windings and between winding and tank. In the main insulation, the highest electric field is often found on the barrier closest to the winding. Moisture content in this area is critical for dielectric strength of the main insulation. It is known that an increase in moisture content from 0.5% to 3.0% may reduce by 50 % the inception voltage for partial discharges. The bottom part of the barriers is more at risk because cooler temperatures will lead to higher moisture contents. The barriers’ temperature is the same as bottom oil temperature.
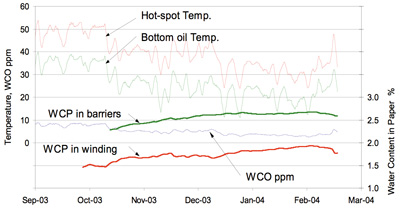
Figure 7
Figure 7 shows temperatures of interest and moisture contents calculated for winding insulation and barriers. Moisture content of the barrier can be significantly higher than moisture content of winding paper. This difference will increase with load as it is mainly sensitive to temperature difference between winding hot-spot and bottom oil.
Regarding the thick insulation, data would need to be averaged over a much longer period. Diffusion rate of these components is difficult to assess since thickness varies over a broad range, the surface in contact with oil is also very variable, as is actual oil flow on these exchange surfaces. A large segment of water in the transformer is stored in thick insulation. Thermal aging for these components is usually not a concern and the electric field sustained by thick insulation is unusually much less than the stress of thin barriers.
6. What to do with Results?
Determining water content in solid insulation has been presented, along with the negative consequences of high moisture levels inside the transformer tank.
Now that the situation is known, it is best to remove moisture from not only the oil, but also the solid insulation. The objective is to achieve a level that will nothave negative influences such as excessive aging of solid insulation and oil. Several techniques have been used for this task with various degrees of success.
a) Traditional Hot Oil Circulation
The traditional technique of circulating hot oil through the transformer has been used in many countries. The limiting factor in this process only removesmoisture from oil and very little from the solid insulation. Once the transformer is returned to service,heat generated in the windings due to the load ‘push’ moisture from the paper into the ‘dry oil’.
b) Low Frequency Heating (LFH)
This technique requires the transformer to be removed from service, with portable equipment brought to the site.
The transformer is disconnected from the grid, and a variable frequency high current power supply is connected to the transformer, together with traditional oil treatment and vacuum pumps.
The transformer is energized at a frequency of less than one Hz and high current, in order to heat the windings of the transformer to at least 80oC to 90oC. It is energized from the primary side, with the secondary side shorted out.
This technique is quite effective as it uses heat and vacuum to remove moisture from solid insulation.
c) Stationary Molecular Sieve Technology
Permanently installed molecular sieves have proven to be effective in drying transformers with oil capacities of up to 30,000 liters.Benefits of this technique are that the transformer is not removed from service, but depends on the transformer in service to generate heat required to move moisture from the paper into the oil. From there oil is circulated through the molecular sieve at a slow rate from whichmoisture is removed with the use of water absorbent beads. This technique is long term, and to observe its effectiveness a monitor with the ability to calculate moisture content in the solid insulation provides the most effective method to stop the drying process.
7. Conclusion
The effect of moisture on thermal aging and reduction of dielectric strength are concerns for aging transformers. If the transformer is submitted to daily temperature variations, a single sampling can lead to large errors on the assessment of water content in paper. On-line monitoring over a period of several months allows for a more dependable assessment.
Moisture content in winding insulation should be treated separately from that in the main insulation. Depending on the type of cooling, temperature at the winding hot spot can be different from temperature at the bottom of the main insulation leading to different water contents. Because of temperature and insulation thickness, moisture diffusion rates can be very different for these two components.
Combining a moisture sensor with more monitoring functionality, such as dissolved gas, makes it cost effective and allows for dependable determination of moisture content in transformer solid insulation.
About the Authors
Brian D Sparling, SMIEEE, GE Energy
Brian D Sparling is the Principal Applications Specialist, Transformer Monitoring & Diagnostics for GE Energy, a business owned by GE Canada. Based in Montreal, GE Energy specializes in the design and manufacturing of advanced systems and technologies applicable to on-line the monitoring and diagnostics of oil-filled power transformers. Brian has over twenty years of experience in the field of power and distribution transformers. For the last 14 years he has been involved in all aspects of monitoring and diagnostics of power transformers. He has worked on many standards committees within the CSA and the Canadian Electricity Association, serving as the past Chairman of the Distribution Transformer Committee. Brian is also a member of the CIGRÉ A2 Transformer committee, the IEEE Transformer Committee. He is a Senior Member of IEEE.
Jacques Aubin, GE Energy
Jacques Aubin is a senior consultant with GE Energy in Montreal. He is mainly involved in development and testing of advance monitoring systems for power transformers. Mr. Aubin was previously with Hydro-Quebec where he directed research activities related to overloading, short circuit strength and acceptance tests on power transformers. Jacques graduated in 1962 from Ecole Polytechnique de Montreal. He also hold a degree from the Institut Polytechnique de Grenoble in France. He is a former member of IEEE transformer committee and he has lead several Working Groups at CIGRE and IEC.