Good data provides the ability to make appropriate decisions regarding an animal-caused outage problem.
In order to understand the animal-intrusion issue, including the cause of the issue, utilities need to measure, establish targeted goals and then make informed decisions to meet or exceed those goals.
Utilities must begin by reviewing their asset management processes for collecting data relating to animal-intrusion caused outages and equipment damage. Utilities need to be more rigorous when it comes to collecting outage data. A lack of data or even inaccurate data can lead to inaction or inappropriate action being applied to a problem. There are a number of reasons why utilities may have difficulty obtaining data; however, performing a review of the data collection methods and driving improvements to the areas of weakness will address this threshold issue. Listed below are some of the top reasons why data has been incomplete or inaccurate and should be used to eliminate reasons why poor data collection processes exist:
- A low-risk outage (momentary outage, limited customers affected, occurrence at night, etc.)
- Data collection did not occur (operator/field personnel were busy, etc.)
- Inconsistent or nonexistent reporting standards (operational drift)
Root-cause analysis, a necessary next step
While time consuming, performing root-cause analysis on a regular basis promotes the discipline necessary to completely understand the cause of any animal-contact issue. The analysis also will rapidly expose common themes, allowing for an informed decision on next steps and an optimized investment in equipment protection. Applying the same practices utilities commonly use for their existing safety-based root-cause analysis is an excellent start to ensuring that this methodology is applied correctly and swiftly.

Source: “The Case for Eliminating Animal-Caused Outages in
Electric Substations and on Powerlines”, FTI Consulting, 2016
(click to enlarge)
Specific animal-caused outage metrics need to be identified and tracked during monthly asset management meetings similar to other operational reliability measures, such as System Average Interruption Duration Index (“SAIDI”), System Average Interruption Frequency Index (“SAIFI”) and Customer Average Interruption Duration Index (“CAIDI”). A more complete review of operational challenges can be performed, and the appropriate actions may be prioritized and acted upon. Suggested measures include:
- Count of animal-caused outages (segmented by voltage):
- > System-wide
- > By planning area or region
- Percentage of animal-caused outages compared with total outage numbers:
- > System-wide
- > By planning area or region
- Number of substations with an Animal Protection Plan (deployment measure):
- > Planned vs. actual by voltage level
- Number of substations inspected for animal-intrusion risk (i.e., damaged fences and damage mitigation equipment):
- > Planned vs. actual
- > Whether outage mitigation is complete or comprehensive
- Number of lines/circuits inspected for animal-intrusion risk:
- > Planned vs. actual
- Work plan completion for animal-caused outage mitigation equipment installations:
- > Planned vs. actual
- Outage root-cause analysis completion rate (percentage)
- Top 10 list of substations with highest animal-caused outages for the fiscal year (i.e., poor performer)
However, before acting on the results of the data, utilities must develop an asset management strategy that acknowledges the problem and their response to it. While animal-contact outage goals currently are not mandated by regulatory bodies, utilities should set aggressive goals at the asset class level to assist with the identification of the riskiest assets. The table below recommends the risk categorization that should be used to help identify and then target the riskiest assets so the prioritization for animal-contact mitigation can be included in the annual planning process. Once these assets are placed on the work plan for the appropriate fiscal year, tracking progress against the plan should be included in the regular monthly review period.
Additionally, the dynamic nature of animal movement and migration, along with ever-changing environmental factors (e.g., urban expansion, industrial buildup, oil or shale exploration) requires a periodic (at least annual) review of substation assets that already have animal-contact mitigation equipment installed. The results of this assessment should lead to root-cause analysis and then a plan for further mitigation – be it replacing the damaged animal-protection equipment or completely redesigning a mitigation plan. These considerations for existing assets may then be included in the risk scoring of the greater asset portfolio.
Cost Recovery Strategies
Since the installation of substation animal protection products is in the public’s interest, it is important for utilities to install the most appropriate solution that will correct the situation. While the cost and the sheer number of substations make the cost to implement a complete solution seemingly difficult to implement in a cost-constrained environment, utilities should prioritize by the high-risk assets and then capitalize the cost of these installations so they can be included in the rate recovery process.
The capitalization of construction costs for a new substation installation can likely occur if the animal protection method is included early in the project initiation process. There is an additional benefit to installing the right protection at a new substation during the construction phase because the downtime that would otherwise be necessary to retroactively install animal guards, for example, is eliminated. Existing substations also can benefit from the capitalization of the installation if the costs are structured properly. Further, proactively installing animal protection yields additional cost benefits in the form of avoided costs that would otherwise be realized by outages.
A capitalized cost case could be justified by meeting certain conditions. Specifically, if an animal protection device is categorized as a “betterment” or “system/reliability improvement”, where it adds to the productive capacity or improves the efficiency of an existing facility, it may be capitalized.
Recommended Approach
The first step:
Following the approaches outlined above can serve the needs of all stakeholders by ensuring an aggressive, cost-effective, customer-centric solution. This starts with the utility reviewing its outage reporting for all substation outages. Knowing where the most vulnerable substations exist supports a risk-based investment approach where high-probability, high-impact areas receive investment priority. Over time, implementation can be applied to all areas in order of priority, and risk containment can be accomplished. Having accurate data facilitates discussions with regulators who can subsequently support cost recovery considerations for these capital programs.
The follow-up action:
Utilities need to establish Engineering Standards to implement cover-up on at risk assets and facilities. As part of defining the engineering standard, utilities should do a comprehensive analysis on the available industry cover up products including their track record of effectiveness, comprehensive coverage/protection capabilities, quality of protection, and achievement of industry guidelines such as IEEE 1656 - 2010. Utilities may need to use a specific class of cover-up such as precise fit or a blended mix of cover-up or fencing suppliers based on the unique equipment requirements and configurations and in consideration of the species that are potential risks to a utility distribution system.
A Case Study: AltaLink Statistical Performance of Greenjacket Outage Mitigation Solutions*
AltaLink, a Berkshire Hathaway Energy company, is Alberta’s largest regulated electricity transmission company. AltaLink manages more than 13,000 kilometers of lines and 300 substations and regularly tracks and reports on animal-caused outages as part of their data collection process.
As part of the effort to improve reliability, AltaLink adopted the use of cover-up to prevent animal caused outages. The following report on the statistical performance of cover-up, outlines the improved reliability performance effectiveness of reducing the instances of animal and bird caused power outages.
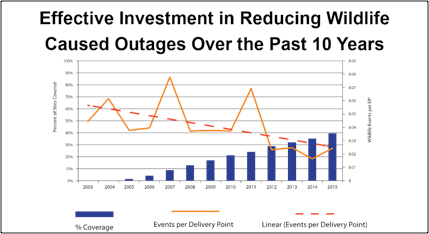
AltaLink has tracked the performance of Greenjacket cover-up at its substations since 2005 and the improved reliability performance is significant. According to Mike Bartel, VP Asset Management at AltaLink, “Greenjacket has improved our load interruption duration performance by 95 percent at AltaLink substations where we had been experiencing frequent wildlife contacts/interruptions. It is rare to find such an investment in reliability that essentially guarantees effectiveness. This type of improvement not only improves our reliability performance, it also improves our customer satisfaction and reduces our impact on the environment.”

Source: AltaLink Statistical Performance of Greenjacket Outage Mitigation Solutions
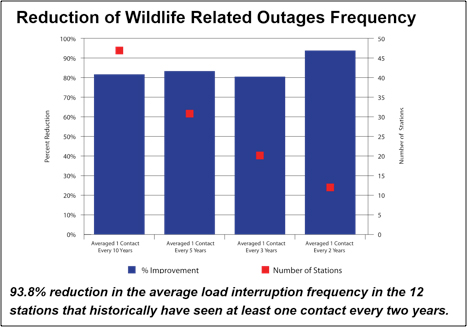
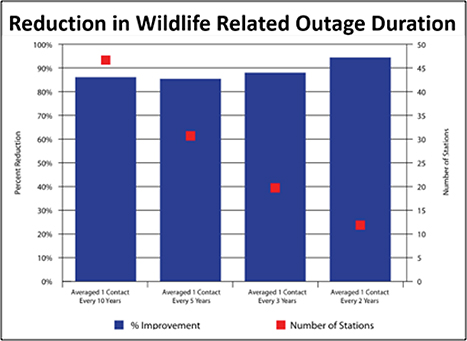
In the set of 47 stations that have seen an average of one or more wildlife contacts every ten years:
- On average, the outage rate due to wildlife contact has reduced from one outage every 3 years to one outage every 16 years.
- On average, the load interruption rate due to wildlife contact has reduced from one load interruption every 2 years to one load interruption every 13 years.
- On average, the load interruption duration due to wildlife contact has reduced from 86 minutes per station per year to 12 minutes per station per year.
In 12 high frequency contact stations where there has been an average of one or more wildlife contacts every two years:
On average:
- The outage rate due to wildlife contact has reduced from one outage every year to one outage every 10 years.
- The load interruption rate due to wildlife contact has reduced from one load interruption every year to one load interruption every 19 years.
- The load interruption duration due to wildlife contact has reduced from 248 minutes per station per year to 12 minutes per station per year.

Source: AltaLink Statistical Performance of Greenjacket Outage Mitigation Solutions
Cover-up by Greenjacket Inc. continues to deliver significant results for AltaLink:
- A 94 percent reduction in frequency of wildlife-caused outages across the substations covered with Greenjacket
- On average, the outage rate due to wildlife contact has reduced from one outage every year to one outage every 10 years
- Reductions in load interruption duration has gone from 248 minutes to 12 minutes; an improvement of 95 percent
Greenjacket plays an important role in AltaLink’s focus on delivering reliability, exceptional service to their customers, and protecting the environment. AltaLink’s 10-year historical performance tracking proves the significant impact that Greenjacket has had on improving AltaLink’s reliability measures. AltaLink has written Greenjacket cover-up into its standards. Based on a risk evaluation, AltaLink continues to deploy Greenjacket cover-up within its remaining substations.

Source: AltaLink Statistical Performance of Greenjacket Outage Mitigation Solutions
About the Author
 Ellen Smith leads the Power & Utility group at FTI Consulting, bringing 30 years of industry experience, specializing in business advisory and litigation support services. Ellen’s areas of expertise include matters involved in power and utility operations, power reliability related damages, utility regulatory strategy, emergency response, strategic communications and Cyber Security.


