
The grid operations team at Sacramento Municipal Utility District (SMUD) has a tremendous amount of knowledge about the company’s infrastructure. So much so that they were able to manage the SMUD grid using a paper wall map, partially accessed by a ladder, and cabinets filled with blueprints and other documents managed by internal knowledge. Then the smart grid arrived and SMUD encountered first-hand what the industry has come to know as ‘the big data problem’
Serving a population of 1.4 million people, SMUD is the nation’s sixth-largest electric utility that’s owned by its customers. SMUD began delivering power to the Sacramento region in 1946 and since then has provided electricity for most of Sacramento County, as well as small portions of Placer and Yolo counties, powering the region’s explosive growth and becoming a nationwide leader in green energy and conservation.
A snapshot profile of SMUD includes:
- Population in their service area: 1.4 million
- Size of their service area: 900 square miles
- Residential customers: 529,695
- Business customers: 68,510
- Number of SMUD employees: 2,036
- Miles of power lines SMUD owns: 10,257
To ensure the ongoing delivery of exceptional service to its customers, SMUD identified and set out to address several challenges:
- With a goal of a balanced and sustainable mix of energy, SMUD gets power from hydropower, natural-gas-fired generators, renewable energy such as solar and wind power, and power purchased on the wholesale market. But with the advent of distributed generation, SMUD operators found they no longer had the ability to analyze distribution data as quickly as before. Apart from the need to correlate the real-time data from multiple sources, the data was in tabular format making it difficult to interpret in a timely manner, especially given the increase in volume.
- Sacramento, located in the hot Central Valley continues to grow and SMUD is particularly concerned with the impact that growth will have on peak demand. Peak demand occurs during the summer when temperatures soar to 100°F or more and customers crank up their air conditioners. Today, SMUD customers push the peak demand for energy to approximately 3,000 megawatts, a number which is expected to grow to 5,000 by 2050. With greater demands on the grid, the need to constantly monitor its health became paramount.
- While SMUD does not have to worry about hurricanes as on the east coast, the threat of fires is ever-present, and high winds constantly stress assets and create outages in certain areas. The utility’s ability to prepare for and respond rapidly to those outages is a high priority, as is reducing outage durations and delivering more reliable service to customers. Understanding what outages have occurred, why they occurred, where they are, and who is working on them, were critical pieces of understanding needed to meet SMUD’s goals.
- With the implementation of smart grid technology well underway, SMUD has experienced a massive increase in the volume of data available to users. Seeking to take advantage of all that data, SMUD found that extracting and correlating the data from myriad systems is not that easy, especially when it is updated at different times and in a variety of formats.
In addition, the implications of changes in one part of the grid on other assets became harder to assess, and planning the rollout of new assets involved a highly complex set of tasks. As Tim Van Blaricom, Manager, Grid Operations at SMUD summarized, “We simply needed a way to synthesize a huge amount of information.”
Visualizing and Analyzing the Grid: Paper to Pixels
SMUD was quick to respond to the challenge and saw the newly generated data as an opportunity to make more efficient decisions, reduce operating costs, and improve reliability of the grid. “The volume of data generated by our smart assets made it clear that we had to continue to innovate to improve the reliability and safety of service to our customers,” said Paul Lau, Assistant General Manager, Power Supply and Grid Operations at SMUD.
As part of its Situational Awareness and Visualization Intelligence (SAVI) initiative, SMUD sought out a situational intelligence solution to help extract data from its siloed systems and analyze and visualize it in one place. The system they implemented, from Space-Time Insight (www.spacetimeinsight.com), helps synthesize and visualize data from disparate sources at a new Distribution Operations Center, providing multi-functional access to correlated enterprise, grid and environmental data.
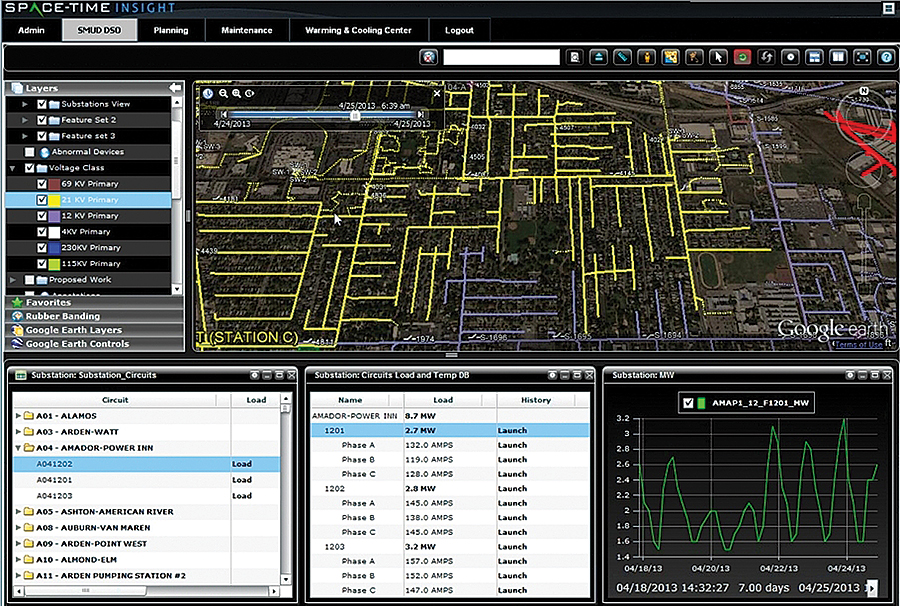
Smart grid data from a variety of sources is visualized through a set of intuitive interfaces
(Click to enlarge)
Situational intelligence is relatively new approach to visualization and analytics. It emphasizes the analysis of data not just in a traditional cube or grid, but also across space, time and node. This allows SMUD to not just visualize, for example, how assets, customers, and employees might be affected by weather and fires, but to also understand how the assets are related (or connected) and what the impact of environmental conditions are over a period of time.
Rather than pulling data from multiple data sources into a warehouse or analytics database (and hence creating yet another data silo), situational intelligence is also about extracting the data as needed from relevant sources and processing it in memory. This approach lends itself well to infrastructures where real-time data needs to be correlated with historical data, geospatial data, environmental data and data residing in enterprise applications.
SMUD’s situational intelligence system, which was implemented in less than 7 months, offers geospatial correlation of data arriving at different speeds in a range of formats from numerous systems, helping users understand current operating conditions and to be better prepared for unplanned events. Historically, this time consuming effort was completed using tabular reports and ad-hoc queries. Now users are able to visually browse at any level desired, like reading a table of contents before diving into the detailed chapters of a book. “The situational intelligence system has established a unifying thread between organizations, improving productivity and filling gaps in communication,” said van Blaricom.
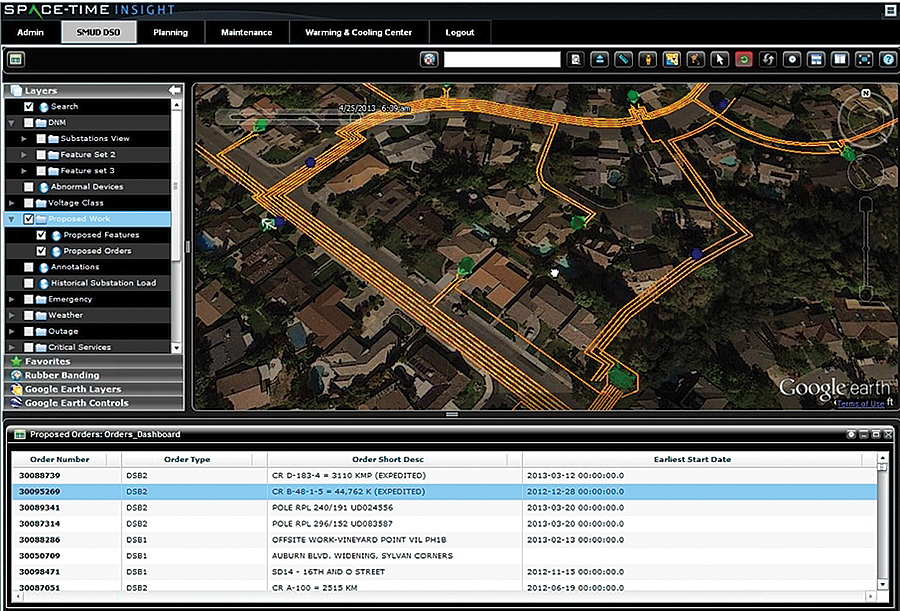
Users can access work order and asset details and pinpoint their location on a map
(Click to enlarge)
Instead of relying on multiple systems, SMUD personnel now have interactive visual access, on the control center video wall and on their desktops, to real-time and historical data from smart grid, distribution, outage, fire and weather systems.
Smarter Grid, Smarter Decisions
A key benefit of the situational intelligence system is the speed at which decisions can be made and the confidence SMUD personnel have in making those decisions. Previously, users relied on historical data such as:
- Annual reports, experience; ‘when the temperature exceeds one hundred degrees, these assets are more likely to fail’
- ‘Tribal knowledge;’
- Gut instinct; ‘that outage is probably caused by the temperature exceeding one hundred degrees and asset X overheating’.
The new system offers extensive representations of different weather and environmental data for the SMUD territory and gives users immediate access to real-time grid performance – some substation capacity and load data is updated every 2 seconds. And when that data can be correlated on-the-fly with weather, fire, or wind data, or information from other systems such as current outages and the placement of field personnel, users are empowered to make well-informed decisions. “The rapid correlation of weather data, emergencies, system load, and situations on the ground significantly improve the accuracy of, and speed the time to, decision making,” added Van Blaricom.
The SAVI system also uses nodal analytics to understand how assets relate to others on the grid and to visualize the flow of electricity. Users can click on any two points on the geospatial display and trace the distribution circuits upstream and downstream from the selected points.
Situational Intelligence Going Places at SMUD
Since its deployment, interest for situational intelligence has grown within SMUD, with myriad other uses identified, from neighborhood design and transformer loading, to customer demographics for new programs, vegetation analysis, and understanding the impact of electric vehicles (EV’s) on single circuits. A second phase of the situational intelligence system is being implemented to meet some of these demands.
“When you make data available across functional boundaries, it becomes a change advocate,” noted Van Blaricom. As an example, he points to insight from estimated restoration times (ERT) that now alert operators when approaching the ERT of an outage, ensuring better communication with customers in a timely fashion.
Situational intelligence has elevated the speed and simplicity of managing and understanding complex data while helping SMUD make better decisions, faster. And these benefits will continue to pay dividends that address many of SMUD’s operational needs well into the future.
Paul Lau seconds the observations of Van Blaricom, Manager of Operations. In Mr. Lau’s words: “With common operational views, personnel across our organization can now implement more cost-effective asset planning and maintenance practices, collaborate as one team to respond rapidly to emergency situations and outages, and more readily understand the real-time impact of weather and fires on our daily operations.”
About the author
 Steve Ehrlich is Space-Time Insight’s Senior Vice President of Marketing and Product Management. With over 25 years of software industry experience and a passion for technology and all aspects of the marketing domain, Steve brings a wealth of product, marketing and executive management experience to the Space- Time Insight team. He previously co-founded and led marketing and product strategy for BUZ Interactive and played similar roles at Apptera, a speech applications provider. Prior to that, as Vice President of Marketing, Steve led speech recognition vendor, Nuance, from startup to market leadership and a successful initial public offering. Steve started his career at Oracle Corporation where he held a range of technical and product marketing management roles. Steve holds Bachelors and Honors degrees in Commerce from the University of the Witwatersrand in South Africa.
SMUD Facts
Profile: Sixth-largest community-owned electric utility in the U.S.
Serves 1.4 million across 900 square miles
Challenge: Use smart grid, enterprise, and environmental data to make faster and smarter decisions
Solution: Has implemented Space-Time Insight Situational Intelligence Suite for Utilities
Net Results:
- Real-time correlation, visualization, and analysis of smart grid, enterprise, and environmental data is driving faster decisions
- Cross-functional communication gaps have been filled, improving operational efficiency and service to customers
- Centralized visualization of data from multiple systems has uncovered opportunities for more effective planning
- Greater understanding of all factors surrounding a situation is improving reliability measures such as SAIDI and SAIFI, and providing greater safety for customers and employees, and protection for crews
- All distribution assets are now aggregated in one place including renewable generation, warming, cooling and building management