The interactive Campus Metabolism (“CM”) website at Arizona State University (ASU) offers a unique inside view into the university’s commitment to sustainability initiatives, including its focus on the value of alternative energy resources and conservation. Beginning in 2004, and in partnership with the Arizona Public Service Energy Services (APSES) group, ASU installed utility-grade instrumentation to accurately monitor the energy usage of its residential and educational buildings on campus. Their current Energy Information System (EIS) was initially created from the gathering of this data.
Drawing on comprehensive data from ASU’s Energy Information System (EIS), Campus Metabolism brings a wealth of valuable information to students, researchers and the public. It also supports the initiatives of ASU’s Global Institute for Sustainability. CM currently covers initiatives at the university’s Tempe (AZ) campus but will expand, along with the EIS system, to include ASU’s three other campuses in the Phoenix metropolitan area.
The EIS system draws on a technology platform from Kepware Technologies for capturing data from the field as well as a SCADA system provided by Control Microsystems (now Schneider Electric), communicating with field data devices located throughout the campus to pull and translate data. The resultant EIS is a secure, Internet-based application that incorporates a user friendly, graphical representation of both real-time and historical data. It documents energy usage at the ASU Central Plant, the Combined Heat & Power (CHP) plant and the rest of the Tempe campus as well as providing a way for the ASU staff to monitor and report energy usage in various buildings across the main campus. It also provides the necessary information to allow the staff to allocate utility usage to the various campus buildings.

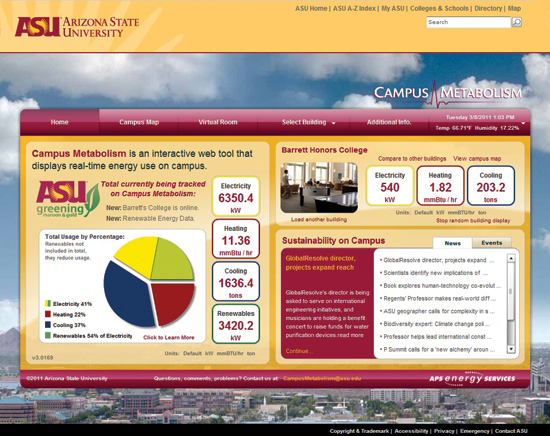
ASU’s Campus Metabolism site allows real-time energy usage data
A dedicated fiber optic network connects all campus buildings to the core EIS database. Key data points such as consumption, temperatures, pressures, and flows for electricity, steam/hot water, chilled water, condensate return and renewable energy production are monitored on a continuous basis from each of these buildings on the Tempe campus.
History of Commitment to Environmental Best Practices
With more than 82,000 students and four campuses, Arizona State University is the largest public research university in the United States. From its beginnings in Tempe, ASU has expanded to include a West campus, a Polytechnic campus and its downtown Phoenix campus. And, as home to The Global Institute of Sustainability, ASU is dedicated to the advancement of research, education, and business practices for an urbanizing world.
The Global Institute of Sustainability is the hub of Arizona State University’s sustainability initiatives. The Institute advances research, education, and business practices for an urbanizing world. Its School of Sustainability, the first of its kind in the U.S., offers trans-disciplinary degree programs focused on finding practical solutions to environmental, economic and social challenges. The Institute also provides leadership and coordination for university sustainability initiatives.
ASU’s framework for addressing the challenges of sustainability builds upon four cornerstones; these are: Education, Research, Business Practices, and Global Partnerships & Transformation. The School of Sustainability trains the next generation of sustainability practitioners, entrepreneurs, and leaders. An emphasis on sustainability across the curriculum directs coursework, research, and outreach toward solving today’s most important problems. A university-wide commitment to sustainable operations encompasses all units at all four campuses. The program places a special emphasis on urban environments, utilizing Greater Phoenix as a living laboratory to address issues with water, energy, transportation and livability.
Making sustainability part of its everyday practices, ASU embarked on an aggressive program of energy conservation and education. Today more than 100 campus buildings with thousands of I/O points are being monitored by EIS at the Tempe campus alone. Energy savings have come in many forms, from improved insulation to energy efficient lighting fixtures but especially from renewable resources like solar.

“The interactive nature of the Campus Metabolism website engages users and entices them to consider their energy impact”
Currently ASU generates about 5,7 megawatts of solar power for its Tempe campus, 4.6 megawatts on its West campus, and 77kW on its Downtown campus for a total of 10.3 megawatts of electrical generation. Furthermore, by the end of 2012, when EIS has been expanded to the other three campuses, it’s expected that more than 18,2 megawatts of solar power will be utilized by ASU and monitored by the EIS.
Contributions of Solar Power
The Phoenix area boasts an average of 334 days of sunshine a year, which puts ASU in an enviable position to be able to leverage opportunities for solar power. (ASU is also the world’s largest university in terms of solar generation with over 9 megawatts of solar power online today.) Overall, ASU has been able to reduce electrical energy consumption by five megawatts during the past couple of years through ongoing performance contracts.
Ameresco Southwest (formerly APS Energy Services) has served as a strategic partner with ASU, with a series of performance contracts and metering projects that have helped ASU modify its systems for even greater cost savings. In fact, the university has created a new fund called the Sustainability Initiative Renewable Fund. Through this fund, ASU is taking the savings generated and putting it into new ways of funding energy renewables that have rapid ROIs. All of the additional solar being added and all of the additional points to be monitored – including the other three campuses – will require significant expansion of the EIS database.
Building the Infrastructure
The entire EIS network on the Tempe campus has a dedicated fiber network completely separate from the normal network backbone. Wherever a fiber connection could not be made, a secure VLAN connection isolated from the student traffic was installed so that it could still be connected to the same dedicated EIS fiber network.
ASU added utility-grade meters to all the buildings but didn’t incorporate any of the building management system, which is completely separate from the EIS. This created the need for a separate infrastructure that continues to evolve. The new meters pull information back to a central server, which provides an instantaneous look at the data. One-minute updates are performed for the first hour, after which the information is rolled up into 15-minute averages. A sophisticated alarm system is also in place that relies on five-day averages to send out warning and alert notifications if utility consumption rises or falls within those targeted parameters.
The communications network connects the field PLCs (Programmable Logic Controllers acting as field data devices) with the SCADA and telemetry applications and pulls data from the utility-grade meters for electricity and utility monitoring. The SCADA system translates the data into Modbus TCP/IP and is then pulled back to the communications server. From there, the data is converted to OPC, and then from OPC into another application (“OPC Systems.NET”), which contains the tagging and data logging capabilities. It is at this point that various computations (e.g., translating instantaneous Kilowatts into KilowattBTUs) are performed.
Similar calculations for flow and temperature can also be performed on the chilled water side, turn it into tonnage. All of this is done in the tag database in OPC Systems, after which OPC Systems moves it into the OPC Datalogger and pushes it into the SQL database.
Campus Metabolism Supports Sustainability Curriculum
Campus Metabolism was originally the idea of ASU research engineer Joby Carlson. As the lab manager for ASU’s National Center of Excellence on SMART Innovations, Carlson wanted to be able to monitor energy use and put it in front of consumers, but also incorporate water and waste with energy data. His goal was to be able to compare data on multiple buildings on campus and teach consumers how they could reduce their energy use. Finally, he envisioned utilizing ASU talent to put it all into a Web-based tool that everyone could understand and use.
Campus Metabolism debuted on May 15, 2008, the result of a joint project that included the Global Institute of Sustainability, ASU Facilities Management, the National Center of Excellence on SMART Innovations, University Student Initiatives, Barrett (the Honors College), the office of the University Architect, the College of Design, the Ira A. Fulton School of Engineering, the Department of Psychology, the ASU student chapter of Engineers Without Borders, and APS Energy Services.
Carlson noted that to see architects, engineers, sociologists, biologists, web designers, students, faculty, staff, investors all at same table talking about one site showed that management at ASU is interested in change, that sustainability is an institutional objective, and that the university is interdisciplinary in approaching problems, not only in research, but also in daily operations.
At the unveiling of Campus Metabolism, it included only energy data and for only one facility. Currently Campus Metabolism contains data from 24 buildings on the Tempe campus and all 21 of the solar power installations. New versions continue to roll out as more and more buildings and systems come online. Plans call for bringing the entire EIS database into Campus Metabolism, where users will be able to view the university’s entire utility structure for all 100 buildings.
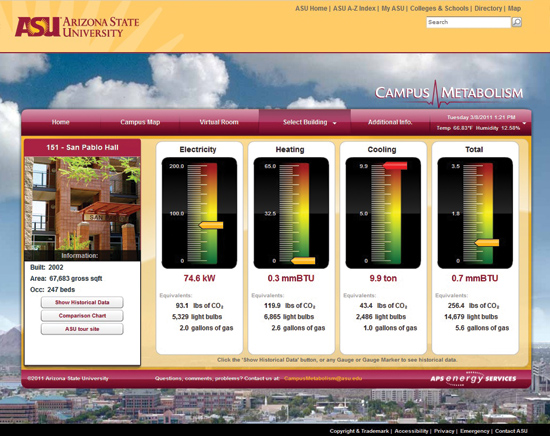
At the Campus Metabolism website, users can view energy data not only in kilowatt hours and BTUs, but in other easily understood measures, such as how many CFLs that energy could light up or the number of gallons of gasoline that would have to be burned to generate it. In addition, users can easily compare buildings against one another or, against historical data – for last week, last month, or last year.

Students and faculty can compare electricity, heating and cooling information across multiple buildings on the campus
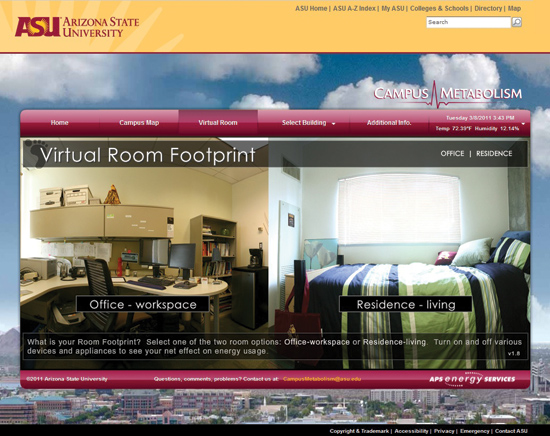
Users are able to view overall energy use in real time in select buildings, view a campus map and click on specific areas to determine energy consumption. Additionally there is a “virtual-rooms” tab that presents an interactive opportunity to learn what energy impact certain items, like lamps, radios, cell phones, etc. have on consumption in virtual office or virtual dorm room spaces.
A new aspect of the site offers multi-point overlays and identifies the impact of temperature, wind and other weather conditions. With colorful charts, graphs and history, Campus Metabolism serves as a significant teaching tool for both professors and students at the Global Institute of Sustainability.
With one of the largest student and staff populations in the country, ASU is larger than many small cities. This means that relatively tiny changes in the university’s resource policies or consumption habits can produce a large impact. Campus Metabolism is the tool to help make that happen. In any situation, if you can quantify something accurately, you can understand how your decisions impact the system. Campus Metabolism provides real clarity into campus energy usage trends – information that can be used to make fact-based decisions leading to future reductions in ASU’s carbon footprint and reaching its sustainability objectives.
About the Author

Robert W. Vandling is a Technology Support Analyst/Coordinator for Arizona State University. He is the Supervisor for ASU Fire Systems, Manager of the Energy Information System and related technologies as well as the sole IT administrator for all of ASU Facilities Management control systems. He is a Certified Energy Manager (CEM) and holds a Masters degree in Information Management from ASU.


