As the smart grid world unfolds with a plethora of new products, new services, new pricing schemes, and a lot of promises, discovering which of them are genuine and will facilitate improved customer satisfaction and value while delivering robust demand management solutions (and new jobs) is a pursuit deemed worthy of many billions of Federal dollars and venture capital. Debates ensue about how best and to what extent to enable customers to be demand responsive and energy aware.
Is that your generator calling – or a disgruntled customer?
How many of your traditional generating units have called into your customer service center to complain lately? While this probably has not actually happened, chances are that even after awarding rebate payments and free equipment, some of your mass-market demand response (DR) customers have called in with issues. And as virtual power plants that include customer resources expand, your call center representatives will need to be well prepared for fielding those issues, quickly and effectively.
Have you deployed load control receiver switches or programmable communicating thermostats? Have any of your customers claimed that your program damaged their equipment, or have any of them experienced “thermal issues”? What strategies will you use to help keep your new smart grid-enabled virtual power plants from calling in to the call center? They will have a big impact on your overall return on investment; especially given customer retention issues and the vast diversity found among distributed resources.
Portfolio Optimization
What are cost-effective and optimal portfolios of dynamic pricing and enabling technology offerings across various customer segments? One promising trend in the DR domain is to deliver more automated control and intelligence into the customer premise, while transitioning classic utility command and control systems for devices into forecasting, optimization, and strategic dispatching systems that can assimilate what many distributed devices have to offer at any given point in time. One expression of this concept is to provide mass customization to enhance customer value and satisfaction, while also delivering enhanced information and management capabilities. Where have you heard that before? That’s right, you and a million other people bought something on the Internet… made just for you.
Can mass customization deliver value in the DR area? NV Energy (NVE) is testing a service that start-up company EcoFactor claims can provide automated and customized energy management. Properly implemented, such a service could potentially be used to enhance the mass-market appeal of utility customer programs, while also enhancing DR capabilities through better forecasting and improved dispatch strategy design and execution.
Demand Response: Then and Now
NVE has deployed mass-market DR programs over the years, utilizing a variety of technologies at scale from one-way receiver switches to two-way programmable communicating thermostats. Starting in 2007, NVE has ramped up its mass-market program from 20 MW to nearly 150 MW, utilizing primarily two-way programmable communicating thermostats. The thermostats are installed at no charge. Customers receive participation-based rebates, and can override DR events at the thermostat if they become uncomfortable during the typical one-size-fits-all four-degree setback events. The thermostats allow programming over the Internet and allow NVE to perform remote monitoring for strategic maintenance and measurement and verification.
NVE serves 45,000 square miles and 92% of the customers across the state of Nevada. But residential air conditioning load in the southern Las Vegas metropolitan area drives nearly 50% of a needle peak that reached 5,880 MW in 2008. Average temperatures at system peak are consistently above 104°F in the summer. (But as you know, it’s a dry heat.)
So, it isn’t too surprising that an actual customer enrolled in the thermostat program – let’s call him Richard – keeps his thermostat set to 89°F during the summer to save money.
Richard called into the NVE call center in 2008 to complain about the standard four-degree setback. He said that by his measurements, his family and pets were able to tolerate a maximum of 90°F, but beyond that, NVE was putting the health and lives of his family in danger by running four-degree setbacks. Richard was reminded in a very friendly way that the program was a voluntary setback program and that he could override if he was hot. But that didn’t go over so well, and he still demanded a program redesign to accommodate his individual needs and preferences.
Richard is one of the 20% of customers that have not (yet) expressed high satisfaction with the thermostat program. So, despite the fact that 80% of customers do express a high level of program satisfaction, and 80% of customers have very low memory recall of DR events – typically between 60-80 event hours per summer – there is still quite a bit of room for improvement. But exception handling is costly and time consuming. Deploying technology that seeks to increase the percentage of customers that don’t even notice the events and don’t perceive an interruption to their lives is one possible methodology in the tool chest to help improve customer satisfaction and program appeal.
Envelope Integrity vs. Program Goals
Some customers choose a summer set point of 74°F, so not only are there great disparities in customer comfort preferences, there are significant disparities in the thermal performance of homes. Some have extremely tight building envelopes that prevent inside temperatures from rising quickly. These homes have high load shed contributions, while other homes heat up quickly, which compromises load-shedding capability.
Pre-cooling is a natural candidate… but how much? End-use loads can be programmed to react automatically to electricity price levels within customer-defined parameters that represent acceptable tradeoffs between comfort and cost. Researchers have been working on this approach for years, but commercialization of these technologies has thus far been elusive.
A New Approach
In May of 2010, NVE learned that EcoFactor had been working to commercialize an automated service to reduce energy consumption based upon premise-specific conditions. The service treats each home individually, based upon its unique thermal properties, the current and forecasted weather, and the preferences of the home’s occupants. The service combines data generated by two-way communicating thermostats with outside weather data sourced from the Internet to learn how each individual home and HVAC system perform under varying conditions; it then optimizes heating and cooling strategies based on that knowledge.
This optimization permits significant energy savings without requiring occupants to give up control or comfort, but what initially caught NVE’s attention was the ability to individually optimize the way each home participates in DR events. The service not only applies pre-cooling strategies, but it can also customize those strategies based on each home’s thermal profile. That is, the length and depth of pre-cooling can be adjusted so as to simultaneously improve the load shed contribution of each home while minimizing energy consumption and reducing the risk that customer comfort will be adversely affected.
NVE arranged to pilot the DR capabilities of this service during the summer of 2010 in the Las Vegas area. It was deployed to manage 25 thermostats in 16 homes. Each participant had previously opted into NVE Energy’s two-way thermostat program, so pre-treatment A/C runtime data already existed. ZigBee communicating thermostats and ZigBee-to-IP gateways were installed in each location, and the gateways were connected to customers’ broadband routers. Nine events were called during the period from August 24, 2010 to September 30, 2010.
The pre-cooling approach taken by the piloted service seeks to minimize both A/C cycling and discomfort by taking into account the thermal storage capabilities of each structure and A/C system, as well as the comfort preferences of the occupants. It automatically chooses pre-cooling strategies based on those constraints. However, it takes some time for the service to learn the thermal profile of the building, along with a series of calibration events.
Due to the late summer start and limited data set, definitive conclusions about the performance of the optimized pre-cooling strategies could not be drawn. This is largely because a larger data set is required to compare various objective functions of the optimization algorithms. However, based upon the limited observations, the service proved promising enough to expand the pilot to a larger sample population (80 customers in Las Vegas and 80 in Reno) to enable observations across the 2011 summer season. The calibration events alone demonstrated that various levels of defined pre-cooling strategies could rapidly be identified as potential offerings for various customer segments due to the robust data acquisition and reporting capabilities of the platform.
Cause and Effect
As expected, pre-cooling strategies applied in conjunction with a four-degree setback strategy increased the air conditioner idle time during the event window compared to the standard four-degree setback without pre-cooling. The piloted service also permitted consumers to adjust their thermostats at any time, including the ability to completely override DR events. Regardless of whether or not consumers opted out of event participation, yield was substantially increased across the population during each of the calibration events.
An example of how various levels of defined pre-cooling increased air conditioner idle time is shown in Figures 1A through 1D. The figures graphically present A/C cycling performance and indoor air temperatures across four roughly similar days and various defined pre-cooling strategies. (These figures are for illustrative purposes only.)
Actual A/C runtime data is derived from the detailed data set, which includes data at 1-minute intervals. Thorough measurement and verification analyses will be conducted on the full data set after the summer 2011 season. The EcoFactor-enabled population will be compared to the overall thermostat population and various customer segments within it using weather normalization and regression analysis. It is clear from the sample figures that overnight and morning weather conditions impacted thermal performance; the optimization model exploits such variations in order to minimize energy consumption and maximize demand reduction during events given customer-defined constraints.
Figure 1A shows a normal day; the air conditioner cycles on and off throughout a typical DR event window (4-7PM) – during that period, it is idle for 57 minutes, or 31% of the time.
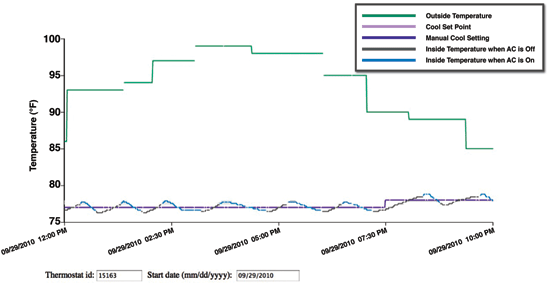
Figure 1A: Temperatures and A/C cycle times, no DR
As Figure 1B shows, with one hour of pre-cooling, inside temperature at the start of the DR event was almost two degrees below the set point, and it took roughly two hours for the temperature inside the home to reach equilibrium at the four-degree higher DR set point.
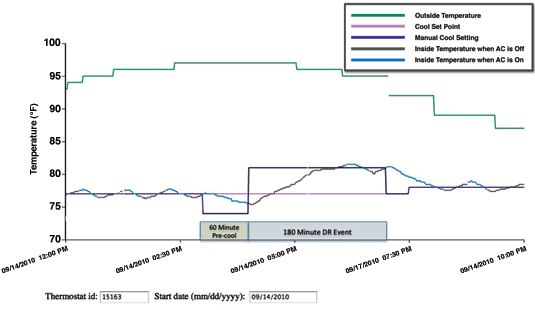
Figure 1B: Temperatures and A/C cycle time, 60 minutes of pre-cool, 180-minute event
As shown in Figure 1C, with 90 minutes of pre-cooling, inside temperature at the start of the DR event was almost two and a half degrees below the set point, and it took roughly two and a half hours for the temperature inside the home to reach equilibrium at the four-degree higher DR set point.
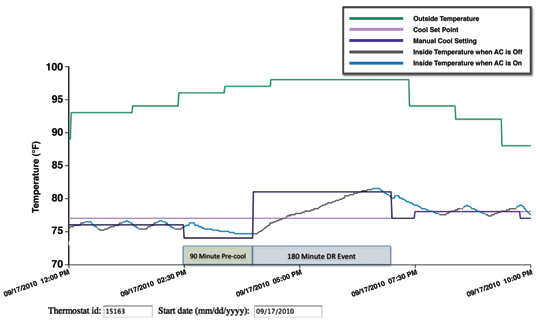
Figure 1C: Temperatures and A/C cycle time, 90 minutes of pre-cool, 180-minute event
As shown in Figure 1D, with 120 minutes of pre-cooling, inside temperature at the start of the DR event was more than three degrees below the set point, and the temperature inside the home did not reach the four-degree higher DR set point during the 3 ½ hour event.
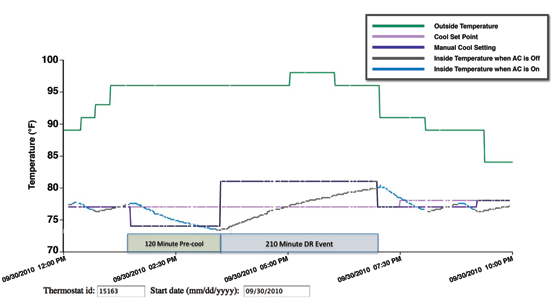
Figure 1D: Temperatures and A/C cycle time, 120 minutes of pre-cool, 210-minute event
A summary of the data included in the above figures follows:

Again, this single premise data is for illustrative purposes only at this point; more comprehensive analysis is currently underway.
An example of how yield can be increased even when consumers opt out is shown in Figures 2A and 2B. Figure 2A illustrates a common occurrence with four-degree setback strategies: the occupant tolerated the load shed until the temperature inside the home reached their comfort limit (about 80 degrees in this case). This triggered a manual override 43 minutes into the event.
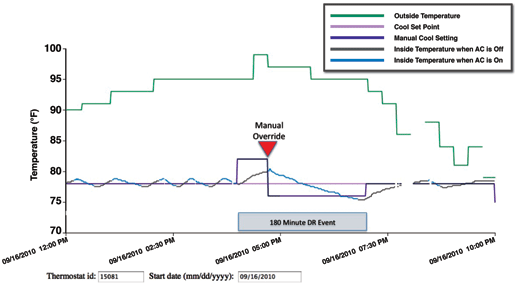
Figure 2A: Temperatures and A/C cycle times, Standard four-degree setback, 180-minute event
Figure 2B shows that pre-cooling can deliver value even when occupants are unwilling to tolerate discomfort. In the same home as shown in Figure 2A, only one day later, significantly better results were obtained with pre-cooling. A 90-minute pre-cooling period meant that the inside temperature when the DR event began was two degrees lower than was the case without pre-cooling. The occupants still ended their participation with an override, but this time the override did not occur until 78 minutes into the event. Thus the load shed contribution nearly doubled.
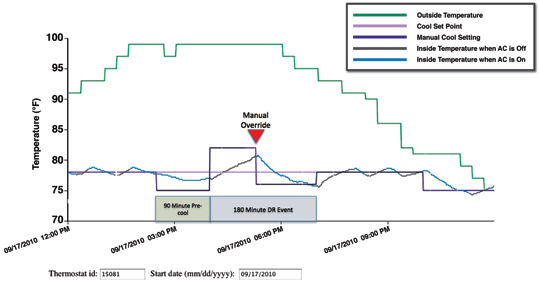
Figure 2B: Temperatures and A/C Cycling, 180-minute DR, 90-minute pre-cool
Conclusions & Outlook
Pre-cooling has the potential to increase DR load impacts by increasing the number of minutes that air conditioners are off during event windows, both with and without customer intervention via override. The system could perform that at scale while providing robust data for analytics. However, does that mean mass customization of optimized pre-cooling strategies adds value?
Could optimized pre-cooling be used to help accommodate Richard’s demands? Could a strategy limited by the customer to plus or minus two degrees of their preferred set point achieve the same load impact results as a standard four-degree setback? If so, would it reduce the number of customers that perceives a comfort impact due to the event?
The 2010 pilot was intended to give NV Energy a preliminary indication of the merits of various pre-cooling strategies based upon premise-specific conditions and the preferences of individual customers. That goal was achieved, and although the limited size of the first-year pilot precludes definitive answers to some additional very interesting questions, the initial results look promising.
About the Authors
Michael Brown has over fourteen years of experience in the energy sector focused on demand response, energy efficiency, and renewable energy in both deregulated and regulated electricity markets and has held a variety of positions at consulting and energy service firms. Since joining NV Energy in 2005, his roles have included the design and implementation of demand-side management programs. His efforts in the Demand Response and Smart Grid domain have included the design and implementation of Cool Share – the largest two-way communicating programmable thermostat program in the country. Michael has a Bachelor of Science in Chemistry and International Relations from The College of William and Mary, and a Master of Business Administration from the The Cranfield School of Management.
John Steinberg has become a forceful advocate for putting consumer value at the center of the smart grid. He co-founded EcoFactor in 2006 in order to bring to market a solution focused on delivering a demand-side solution that consumers will actually want to use. John has been issued 17 US patents covering innovations in energy management as well as such diverse fields as digital photography, networked printing, and various mechanical devices.


