
Using Automated Meter Reading (AMR) tamper information to identify high-quality theft cases was a strategy that never really materialized. Why? Because the valid information was lost in a mountain of distracting and bogus data. Some were due to utility activities and some of the distracting data were just plain false alarms.
So here comes Advanced Metering Infrastructure (AMI) to the rescue, right? Wrong—unless we use the data correctly. We will get consumption data and tamper flags much more frequently, but we’ll be no better off unless we use better techniques to filter and analyze this new wealth of meter-reading data.
Valuable new data
Currently a typical one million-meter utility stores 24 million billing-related transactions over a two-year period. The transactions are usually actual meter reads, but can also be entries for transactions such as estimated readings or voucher bills. When new readings are captured, the oldest readings, usually from twenty-four months earlier, are eliminated or backed up on a different system. This scheme varies greatly, based on the type of Customer Information System (CIS) used, but this is the most common form of archiving and storing data. Twenty-four readings provide a good comparison of historical usage for Customer Service Representatives and provide enough history to support back billing for defective meters, under most state regulations. However, twenty-four monthly reads is not enough information for a consumer to make decisions about how they use energy and how best to conserve it.
A major driver for AMI instead of AMR is getting this decision-support information into the hands of the energy users. AMI will provide consumers with an hourly view of their energy usage, and will provide this view for a longer timeframe than in the past. For instance, utilities in California are planning to store electric readings at one-hour intervals for up to seven years. This offers customers a tremendous tool for analyzing their energy use and making adjustments to their behavior.
Using new data in new ways
The frequent data provided by AMI also provides new opportunities for utilities to detect metering issues and theft. However, before that can happen, all of this data must first be stored and managed. The same one million-meter utility that stores 24 million reads today will need to store over 60 trillion hourly reads over seven years. That is a whopping 60,480 million reads versus 24 million reads, for just one million meters!
Along with a greater volume of reading data comes an overwhelming amount of meter-tampering information. As a real-life example, a 1.4 million-meter utility with mobile AMR received 143,000 tamper flags over two years. A similar-sized utility, with a fixed network AMR system, received 6 million tamper flags from their nightly reads during the same period. A simple extrapolation tells us that with AMI, the number of tamper flags for that same-sized utility would exceed 100 million for the same two-year period.
The Meter Data Management (MDM) suppliers have come to market with tools that can easily handle the AMI data storage amounts. They have also demonstrated their ability to process these large quantities of reading data for billing processes like VEE, complex billing, and data aggregation. But analyzing data for theft or meter failure is different. In response to utility demands, each MDM supplier has developed some form of theft-detection tools that can generate lists of suspect accounts, based on consumption and tamper data. However, the original problem is not solved. Too much data still exists and in fact, with AMI, it is one thousand times worse; the valid data gets lost in the reams of false alarms.
Given the fact that a typical one million-meter utility investigates 500 to 5,000 revenue protection cases per year, 60 trillion reads and 100 million tamper flags, of varying validity and value, does not help.
The problem with too much data
The following simplified electric or gas consumption plot represents a two-year profile for a seasonal home. This is a common situation for all utilities and is becoming more common, as the baby boomers retire and split their time between two homes to avoid extreme weather conditions.
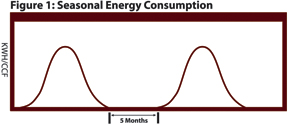
Assume that there is an AMI system that generates a “Zero Consumption for 24 Hours” flag each read and an MDM or CIS that generates a “Zero Consumption for 30 Days” flag each month. If meter problem detection is processed at the normal processing period of each system (hourly for AMI and monthly for MDM/CIS), then this seasonal residence, as shown in Figure 1, would have been the result of 3,600 “Zero Consumption for 24 Hours” flags and five “Zero Consumption for 30 Days” flags during the five months that it was unoccupied. The odds are that the flags would have either been turned off or ignored, or an overloaded revenue protection crew would have been sent out to investigate the situation. This visit would hopefully result in the account being noted as seasonal in the CIS, but may simply cause the flags to be turned off.
The above example highlights an instance in which micro-analysis of a situation generates many valid, but meaningless, events. We must be careful, though, as simplified schemes to minimize the data overload have been proven to hide the valuable information.
No harm was done in this case by turning off the annoying meter issue detection flags. But what if the meter had become faulty during the five-month period when the home was vacant? (See Figure 2.)
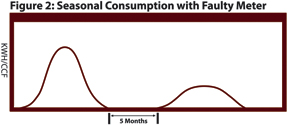
If the tamper flags were turned off for this account because of data overload, then the season-over-season drop will go unnoticed. If they were not turned off, then a new flag might come in from the MDM or CIS indicating a reduction from prior-year consumption; however, there are many valid reasons for this.
We have thousands of new data elements—how can we use them to find cases with valid issues without sending crews to every site? The answer lies in the use of multi-modal analytics.
Multi-modal analytics
Remember the phrase “Can’t see the forest through the trees.” That is what multi-modal analytics is designed to solve.
With multi-modal analytics, patterns and statistics are analyzed on a monthly basis (the forest) and then analysis of interval data (the trees) is used to support the macro-level detections.
Limited revenue protection resources cannot afford the time it takes to chase tamper flags and consumption deviations at the microscopic level. Localized power outages, electrical work, and customer behavior patterns can mislead us if we look too closely. We need to take a step back and look at the forest before getting confused by focusing on the trees. We need the microscopic details, but we need them to validate what is seen on a macroscopic level. The two layers of analysis then compliment each other.
The design of a multi-modal analytics system can be seen in Figure 3.
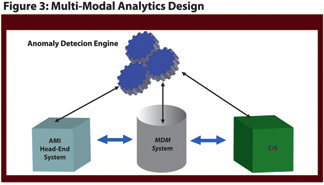
The lower systems are the standard AMI components: AMI head-end, MDM, and CIS. The new component to the system is an Anomaly Detection Engine (ADE). This system sits above the massive flow of new AMI data, but requests and processes it as needed.
The term anomaly detection is used for the detection of abnormal patterns, not just theft or low consumption, since the same techniques can be used to identify targets for energy conservation programs, as well. The remainder of this discussion will, however, focus on the use of this analytic tool for identifying metering issues.
An ADE starts with information from the utility’s CIS. This information is then supplemented with additional data from external databases, such as business listings and tax appraisal databases1.
Inferential Modeling techniques are then used within the ADE to derive additional information about each account. Inferential Modeling techniques compare hundreds of features within the consumption profiles and classify accounts by attribute. The type of information that can be inferred about a residential account includes:
• Use of property (permanent residence, vacation home, vacant dwelling)
• Expected occupancy period
• Heating fuel type
• Air conditioning (yes/no)
• Square footage
• Swimming pool (yes/no)
The valuable inferred information from our previous example is the use of the property and the occupancy period. With the correct classification of the seasonal residence shown earlier, the ADE will be able to filter out the false flags it received from the Head-End, MDM, and CIS systems during the vacant period, but draw attention to the drop in consumption during the occupied period.
A risk score is assigned based on lower year-over-year consumption. This score increases as the pattern continues for several months. When the risk score reaches an established threshold, micro-analytics is initiated to validate the suspected issue.
The ADE requests finer resolution data in certain time periods from the Head-End, MDM, or CIS that is storing the interval data. Figure 4 shows the daily consumption profile for the month following the expected occupancy of Figure 2. The profile clearly shows an abnormally erratic consumption pattern, indicating mechanical failure of the meter.
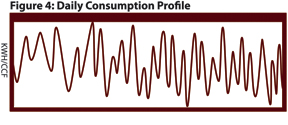
A smooth daily profile, with reduced year-over-year consumption, would indicate a change in use or even an imminent property sale. Further investigation by an analyst would be required in this situation.
Another example in which multi-modal analytics is extremely useful is when a single secondary phase of a three-phase commercial Current Transformer (CT) service is lost. This can be caused by a secondary side fuse blowing, wiring issues during construction, or even a test switch being left open during routine maintenance. Figure 5 shows the most difficult situation to identify, when the abrupt drop in consumption occurs in the fall as the air conditioning load is dropping quickly. This type of metering issue is easily identified during peak or minimum-load periods.
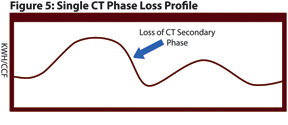
The resulting measured consumption is approximately one-third less than the prior year, but energy-efficient HVAC changes on a commercial account would result in the same profile.
An ADE contains an algorithm that looks for one or more metering lines being lost on CT equipment. The risk score assigned for this case through this macro-analytics approach would not be very high, but it would identify the expected month of the event. A daily or hourly extraction of the readings during the month in question will show an abrupt loss of consumption on one line, and will justify a revenue protection investigation.
The investigation could have been initiated through single phase loss analysis at the MDM level, but there are many valid and temporary reasons for this to occur. There is no use sending a crew to the field to investigate a situation that is normal and will resolve itself.
The forest, then the trees
Macro-analytics techniques for identifying metering issues and theft have been successfully deployed for several years. In fact, over 20% of the commercial electric meters in the Unites States are being monitored by an ADE today.
The deployment of AMI does not necessitate the replacement of this proven revenue protection approach, but provides an opportunity to improve.
Anomaly Detection Engines are designed to process complex multi-dimensional models, but not in the volumes of multi-year hourly reads. The new AMI systems are designed to store and process large quantities of meter reading data.
The capabilities of these two types of powerful systems provide a great deal of value to utilities that deploy both.
About the Author
Michael Madrazo is the founder and President of Detectent, the pioneer in Anomaly Detection solutions for metered services. Detectent continues to develop leading-edge tools that integrate valuable information from many systems in order to identify cases of incorrectly-metered electric, gas, and water service. For more information about Detectent, visit www.detectent.com or call 760-233-4030.
____________________________________________________________________________
1For further details see Electric Energy T&D Sept – Oct 2006: Integrating Data from Many Sources Provides New Opportunities in Energy Theft Detection


