Decarbonization is a goal for many communities, counties, cities and states throughout the U.S. However, decarbonization cannot happen with our real-world projects being implemented by the masses. So, the ultimate question is: what is the proper path to understanding and building cost-effective projects that meet these goals? And electrification may be the key. If you are building a decarbonization project, or have already started one at your facility, here is a handy electrification checklist to consider before funding your decarbonization project!
Let’s start at the beginning. What is electrification? Electrification is the practice of designing or changing, machinery to use electricity as a fuel source. This practice is also commonly referred to as “fuel switching." Cars converting their combustion engines to use batteries charged with electricity is the most common example of electrification today. When considering electrifying the equipment in your facility, we need to work through the following checklist: Energy Auditing, Work Conversion, Prices, Incentives, & Project Funding.
Energy auditing is the first key to building a sound electrification project. Energy auditing is the practice of categorizing and organizing the equipment types that may be eligible for electrification. This practice consists of capturing nameplate data, pulling specification and performance sheets of those equipment model numbers and obtaining mechanical drawings of the equipment to fully understand the design intent of the machinery. Obtaining this information does take time and is generally why auditing costs are higher than we would like them to be.
The types of audits that everyone should be looking to obtain are ASHRAE Level 1 and Level 2 energy audits. Level 1 audits range from $0.08 per square foot to $0.15 per square foot. A level 2 audit ranges from $0.15 per square foot to $0.25 per square foot. On a 100,000-square-foot facility, a level 1 and 2 ASHRAE audit would run $23,000 on the low end. These necessary auditing costs are generally recouped in the energy savings measures derived; however, there may be no need to pay for energy audits depending on your local utility. For example, San Diego Gas & Electric (SDG&E) offers a no-cost Comprehensive Audit Program (CAP) where you receive an ASHRAE Level 1 and Level 2 audits.
The second item on our checklist is work conversion. Work conversion is the math behind normalizing two units of energy into one common unit of energy to understand their relationship. In an electrification project, we are generally working on converting units of natural gas, or Therms, into units of electricity, or kilowatt-hours (kWh). To make the conversion we need a common energy unit to unite the two units. That common unit is the British Thermal Unit or BTU. A BTU is a unit of heat, or ability to perform work. Converting a Therm or a kWh to a BTU is very straight forward but the conversions aren’t commonly understood and are among the main points in understanding electrification. There are 3,412 BTUs in one kWh, and there are 100,000 BTUs in one unit of natural gas (Therm). Obviously, Therms can do more “work” since they contain more BTUs, but Therms have the ability to do about 29% more work unit-over-unit. This can create an issue for electrification projects, as the end result is that the machinery must be able to get the job done in the same/similar fashion as it was consuming a different fuel source. The output from your energy auditing efforts will reveal how much more kWh you may need to consume to complete the same amount of work the machinery was doing while consuming natural gas. The energy analysis would yield the potential value of the electrification project and the outcome could be very different for different folks.
Our third item is prices. Unit pricing is probably the most important variable in ensuring you have a successful electrification project. There are two ways we need to look at prices. The first is to look at your utility tariffs and your annualized billing for both gas and electric. When evaluating your utility tariffs, the idea is to derive an accurate blended rate for each unit. A typical blended for electricity, depending on where you live, can be $0.07 / kWh up to $0.35/kWh, and a typical blended rate for natural gas (Therms) can be $0.75 / Therm to $1.50 / Therm. The higher your Therm blended rate and the lower your electric blended rate is one indicator that you might have a very successful electrification project on your hands. Conversely, if you have a very low $/Therm and a very high $/kWh then electrification projects may become difficult to implement. Two quick examples of each scenario’s opportunity/cost:
- If your current fuel costs are $0.07/kWh & $1.25/Therm and the existing machinery currently consumes 100,000 Therms annually, that will cost you $125,000/year to operate. The same machinery, operating on electricity (kWh), would be able to consume 1,785,714 kWh annually before the project would “break even”.
- If your current fuel costs are $0.35/kWh and $.75/Therm and the existing machinery consumes 100,000 Therms annually, that will cost you $75,000/year to operate. The same machinery, operating on electricity (kWh), would only be able to consume 214,285 kWh annually before the project would “break even”.
The second way we need to evaluate pricing is to look at the Consumer Price Index (CPI) and see how the prices of units changed on a national level, over time. The CPI is calculated by the U.S. Bureau of Labor Statistics and can help bring these numbers into focus. Obviously, past performance is not purely indicative of future performance but it is a decent indicator to monitor.
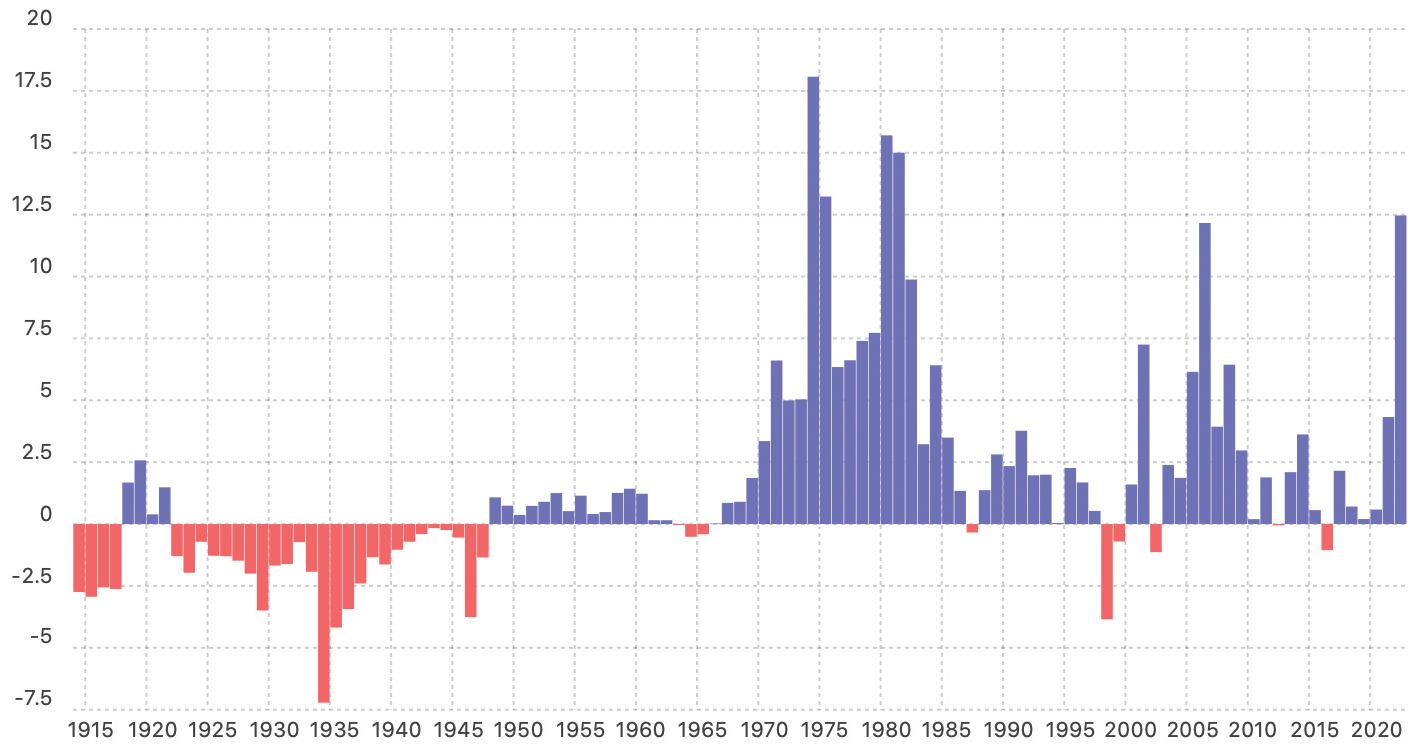
Price Inflation for Electricity since 1913
Consumer Price Index, U.S. Bureau of Labor Statistics

Years with the largest changes in pricing: 1974 (18.07%), 1980 (15.70%), and 1981 (15%).
Source: https://www.in2013dollars.com/Electricity/price-inflation
Over the last 109 years, electricity experienced an average inflation rate of 1.54% per year. In the last two years on the graph, 2021 & 2022, the electricity inflation rate has been 3% and 7.5% respectively.
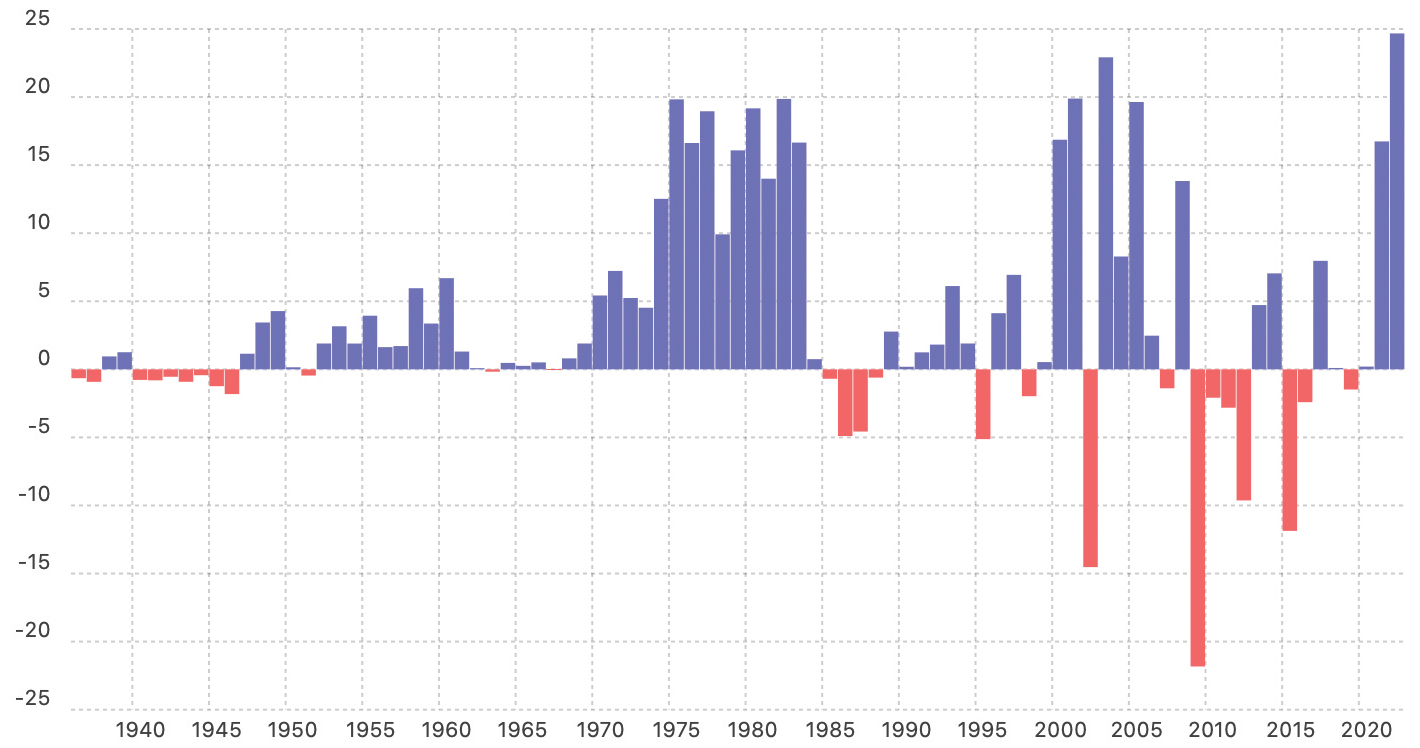
Price Inflation for Utility (piped) gas service since 1935
Consumer Price Index, U.S. Bureau of Labor Statistics

Years with the largest changes in pricing: 2022 (24.68%), 2003 (22.92%), and 2009 (-21.83%).
Source: https://www.in2013dollars.com/Utility-(piped)-gas-service/price-inflation#:~:text=The%20current%20national%20average%20price,of%20change%20indicates%20significant%20inflation
Over the last 97 years, natural gas experienced an average inflation cost of 3.38% per year. In the last two years on the graph, 2021 & 2022, the natural gas inflation rate has been 16% and 15% respectively. Therefore, historically, there is a cost value reduction hedge, nationally, towards electrification based on the inflation of the two units of energy.
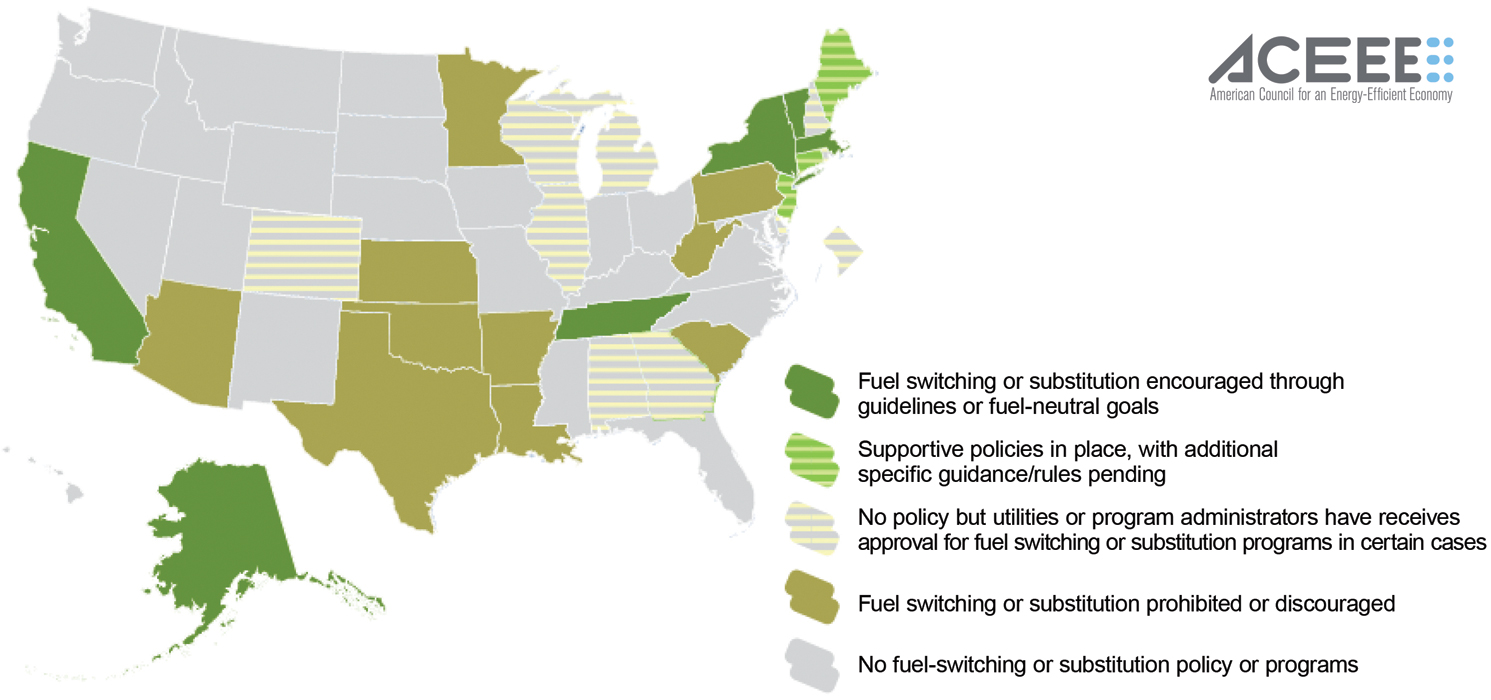
The fourth item on our electrification checklist is utility incentives. Incentives for electrification projects are driven by the local utilities. Investor-Owned Utilities (IOUs) are driven by policy set by the State and the Utilities Commission that govern each territory to which they are assigned. Therefore, it becomes important to understand the policies around fuel switching for each State in the Union. In May 2020, the American Council for Energy-Efficient Economy (ACEEE) released a policy brief on state policies. The figure below highlights the five different categories that the governing policies fall within.
The reason we need to understand the policy focus is that their policies will dictate if a utility can, or will, offer a utility incentive for electrification. Keep in mind that fuel switching can go both ways, electricity to natural gas, or natural gas to electricity. However, we are focusing on only one way of fuel switching for electrification and that is natural gas-consuming equipment converted to equipment that consumes electricity. The policy category that ACEEE has identified that alludes to supporting electrification is the “Fuel switching or substation encouraged through guidelines or fuel-neutral goals”. This verbiage is indicative of a policy in place that allows for flexibility. The states that have these policies in place are California, New York, Vermont, New Hampshire, Tennessee and Alaska. These states are most likely to provide incentives for fuel switching/electrification. Most of the electrification projects would be classified as custom incentive projects and would yield incentives. Custom incentives set by SDG&E are $1.25 per unit of natural gas (Therm).
Fuel-switching policy status by state

Source: https://www.aceee.org/sites/default/files/pdfs/fuel_switching_policy_brief_4-29-20.pdf
There are also new “pilot programs” emerging in the state of California that are focusing on reducing the Green House Gas (GHG) emissions versus the specific units of energy we mentioned previously. One program that brings electrification into focus is SCEs called the Clean Energy Optimization Pilot (CEOP). Pilot programs always have the ability to become a “main-stream program,” but that evolution is highly dependent on the program’s success/cost-effectiveness. SCEs GHG reduction pilot program supports electrification in a big way. Natural gas, or Therms, are very carbon intensive. You can reduce a tremendous amount of GHGs annually by executing electrification projects and receive a very hefty incentive per unit of GHG reduced. The value of each unit is somewhere around $600 per unit of GHG reduced year over year. There are many technologies that are maximizing the value of the CEOP program. One of them is the High Efficiency Dehumidification System (HEDS). HEDS is an HVAC technology that is aiding in electrification and therefore eliminates, or reduces, the need for facility Therm consumption. Because the Therm savings are carbon intensive it translates into high GHG reduction. The estimated incentive for installing one HEDS unit, in the CEOP program, can be anywhere from $90,000 to $170,000 per unit. Extremely lucrative!
Our fifth and last item on our electrification checklist is project funding. If you have made it this far in your project checklist, chances are you have derived a valuable project and now it needs to be approved internally and funded. Before you take the project to your CFO or approval board, it is important to research the financing options that may be available to you. Bringing multiple funding options to the table does a few things. First, it shows that you care about the project and have put as much forethought into it as possible. Secondly, it provides the reviewer(s) multiple options to say “Yes!” If you only bring one possible solution to them, asking for funding, they might not be in a positive financial position to say yes to your funding request at that time.
However, if you bring low, or no, interest financing options to the table you increase your odds of implementing your electrification project. Examples of no/low interesting financing options are the California Energy Commission’s Energy Conservation Assistance Act and San Diego Gas & Electric’s (SDG&E) 0% Interest On-Bill Financing Program. The CEC financing program offers 1% financing, only to cover their administration costs and has a very wide net of eligible energy projects that can receive the funding. SDG&E financing program has a lower interest rate, zero; however, they have a very tight focus on energy projects that can be funded using this option. And of course, there are always market-rate financing options and there are many companies who can provide this service for electrification projects; however, they will be at market interest rates, which are currently rising. If market rate financing is the only option for your project, be sure to understand how much more interest you might be paying on the project, compared to funding it internally, as the interest could easily detract, or eliminate, the value of the savings from the electrification project.
 Christopher Roman currently leads the strategic business development for Conservant Systems. Roman is a dedicated energy industry professional who has previously held positions at A.O. Reed & Co., San Diego Gas & Electric and UC San Diego Health. Roman has established himself as a creative problem solver who brings unique solutions to complex problems. Roman is also passionate about improving the indoor air quality (IAQ) of facilities so that 99.99% of pathogens are removed from the air we breathe.


