High Energy Piping (HEP) systems in the aging fossil power stations are subject to creep, fatigue and other cracking processes that can lead to their failures. Therefore, they must be periodically inspected to meet safety and economic requirements. Current guidelines that suggest a full inspection of HEP every 3-5 years are too expensive to comply with and therefore are partially met if at all. Bridging between the economical constrains and the extended maintenance needs, can be done by systematic online monitoring programs of HEP lines.
The Quantitative Acoustic Emission (QAE) Non Destructive Inspection (NDI) which had been used for variety of applications, has been modified for the diagnosis of creep and other flaws in HEP during operation as well as for monitoring changes in the lines integrity over time. This included:
- Creating AE fingerprints of flaws developing in the original metal used for the HEP and the same metals with creep at different stages.
- Defining the AE criteria for evaluating the danger level of such flaws.
- Development methodology for filtering the background noise of the operating HEP.
The Acoustic Emission Phenomenon and its Interdependence to Fracture Mechanics Characteristics of the Metals
Structures and materials under deformation and flaw-development processes emit sound and ultrasound waves – Acoustic Emission (AE) signals. These signals can be acquired by piezo electric sensors, digitized and analyzed. The analysis can reveal the location of flaws, their type and danger level. Since flaws development occur under load, the consequent AE signals can be acquired during operation, pressure test or cool down.
IThe correlation between AE signals and fracturing characteristics of the different types of steel used for the HEP was established by simultaneous analysis of AE signals that had been acquired during fracturing of compact specimens of these specific metals (mostly P22 and P11) with and without fatigue cracks, and during loading of specimens without cracks up to the yield point. Specimens of P11 and P22 with creep were tested as well.
A special statistical tool – ellipsis of dispersion was modified and applied to the analysis of the AE signals. The ellipsis of dispersion is derived from the average of the AE signals parameters, their deviation and the correlation between them.
Laboratory investigations established the singularities of the AE signals and revealed that:
- There is interdependence between the AE characteristics, mechanical characteristics of the P11, and P22, and the J-integral value.
- The standard deviation of AE characteristics, when J-integral value varied, was reasonable for practical diagnostic purposes.
- The ellipses of dispersion of the AE signals’ energy/average frequency for different values of J1c can be used for distinguishing between different stages of flaw growth with an accuracy of not less than 90%. Therefore they are effective tools for monitoring the growth of flaws quantitatively, through changes in their J-integral value.
- Flaws can be detected under the designed operating load with a reliability of not less than 85%, if their J-integral value is about 0.075J1c. The reliability increases to about 95%, when J-integral value is greater than 0.2J1c.
- The ellipses of dispersion derived from energy-average frequency can be used as material-flaw-type specific AE fingerprints.
Ellipses of dispersion of AE signals that characterize the individual processes of slow stable crack growth, creep, plastic deformation around pores and fracturing of oxidation scale were constructed. The results revealed that these processes could be distinguished one from the other with sufficient accuracy for practical diagnostic purposes.
In a typical inspection of HEP, AE signals are acquired during operation under constant and varying pressure and temperature. The sensors are installed on wave-guides, which are welded on to the HEP or mechanically coupled to the piping (if welding is not allowed) throughout the entire length of the line. The distance between the sensors is 20ft or less and they are positioned in areas which are vulnerable to flaw development.
Location, Type Recognition and Danger Level Assessment of Flaws by QAE NDI Method
The AE signals are amplified a million-fold and recorded by AE data-acquisition unit. The recorded signal’s parameters include amplitude, energy, RMS, counts, duration, rise time, counts to peak, average frequency, and waveform.
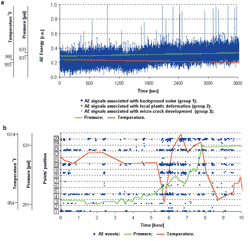
Figure 1
Analysis of the recorded signals starts with a characterization of various AE signals including background noise. This is done by investigating the graphs of AE signals’ energy synchronously plotted with pressure and temperature variations (Figure 1). In the following example there are three groups of signals:
- Low energy signals similar to continuous AE that can be characterized as background noise.
- Median energy signals of about 20-25% higher than group 1. These signals are not associated directly with the pressure change. They appear only in several zones of the piping and have typical indications of flaws with low stress intensity, such as local plastic deformation around pores and/or creep.
- Highest energy/frequency signals. Signals of this group appear when the temperature increases, achieve their maximal value, and then decrease. Since such AE characteristics usually indicate development of flaws with high stress intensity, the presence of these signals can be attributed to growth of micro-and macro-cracks.
Based on this initial analysis, the background noise is eliminated by non-linear filtration followed by plotting the probability density graphs of AE signals “energy-average frequency” of the signals acquired from all sensors (Figure 2) and extracting the ellipses of dispersion “energy-average frequency” of AE signals.
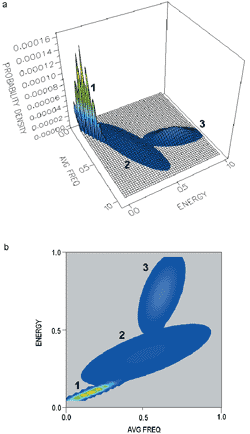
Figure 2
Three-dimensional graphs of probability
density and ellipses of dispersion of AE
signal “energy-average frequency”
1. Background noise.
2. Local plastic deformation around pores.
3. Individual micro-cracking.
Fracturing of hard inclusions.
Flaw types and their danger level are determined by analyzing the ellipses of dispersion of the AE signals and comparing them with the AE fingerprints of:
- Different value of J-integral for the fracturing of the specific material.
- Creep development.
- Local plastic deformation around pores.
- Fracturing of hard inclusions.
In the example in Figure 3, the flaws were identified as creep in a longitudinal seam weld and micro-cracking in a girth weld.
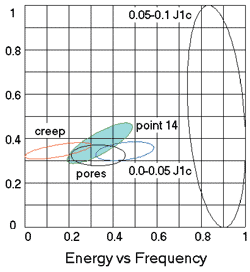
Figure 3
Transparent ellipses are the fingerprints.
Solid ellipse is calculated from the AE signals from the inspected structure.
Ellipses 1-4 are the AE fingerprints of
stages of fracture development
Ellipsis 5 is the AE fingerprint of creep.
Ellipsis 6 is creep in inspection point No 4.
Ellipsis 7 is micro-cracking
in inspection point No 23.
Ellipsis 8 is micro-cracking
in inspection point No 23
six month later.
J1c was selected as a fracture criterion due to the specific nature of fracturing of the HEP steel, its longitudinal seam welds, girth welds and hangers. The J-integral was selected also due to it’s:
- Independence of the scale and shape of the units being tested;
- Functional connection with AE energy parameters.
- Its usefulness as a marker for monitoring of flaws’ growth.
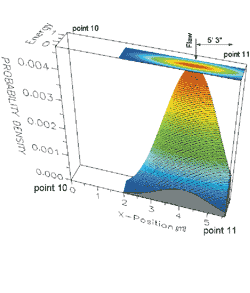
Figure 4
Example of flaw location between sensors
The results of a typical inspection are
summarized in an isometric drawing
(Figure 5)
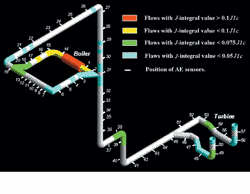
Figure 5
Location of flaws along an inspected line
and their J-integral values. Flaw types are
listed in a table of results
The 0.1J1C value was selected as a threshold value above which flaws should be frequently monitored, or even repaired. Similar conclusions should apply to flaws with J-integral value lower than 0.1 J1C if this value increases in two consecutive inspections.
Determination of the location of the flaws comprises two methods: a) a high-threshold filtration of AE signals - above 200 kHz: and b) highly sensitive AE signal acquisition. None of the methods is reliable enough when used alone. Using both provide flaw location at an accuracy of ±5% (Figure 4) of the distance between the sensors.
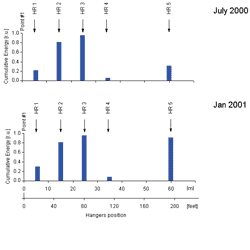
Figure 6
Changes in the AE activity of hanger No 5
over a period of 7 months
Hangers and Supports Performance
Proper performance of hangers and supports is essential for the entire line integrity. AE power distribution along the line is an indication of the uniformity of stresses distribution. Non-uniform distribution of stresses (Figure 6) is often a result of poor performance of hangers and supports and it should be taken in account for preventive maintenance.
The monitoring concept
Changes in the J-integral value from one inspection to another are very powerful indications of developing flaws while lack of such changes is an indication for non-developing mostly fabrication defects. Monitoring of cracking processes can be done through repetitive inspections and looking for deviations of J–integral values from an initial baseline. The J-integral value of the flaw described above increased from 0.1J1c to 0.2J1c over a period of 5 months (Figure 3 ellipses
7 and 8). This is an indication of a relatively fast growing flaw.
AE activity around Hanger HR 5 (Figure 6) Increased 3 times fold over a period of 7 months. Visual inspection identified and confirmed that the hanger above HR 5 stopped performing and as a result HR 5 was over loaded which resulted in overstresses and increased AE activity.
Changes in the J-integral values or in the AE activity are easily detectible and they provide information regarding the intensity of flaws development. Observing such changes is the backbone of the QAE NDI based monitoring system. It provides useful information for preventive maintenance and for extension of the life-span of components.
References
1. G. Muravin Inspection, Diagnostics and Monitoring of Construction Materials and Structures by The Acoustic Emission Method, Minerva Press, London, 2000, 480p.
E-mail: dmargan@attglobal.net


