All stakeholders are interested in making the utility sector more “customer-centric.” For most of the sector’s history, customers have been viewed as rate-payers rather than individuals with different preferences and needs. This is slowly changing to allow for more customer options and choices.
In late 2018, DEFG LLC and the Utility Customer Research Consortium conducted the Annual State of the Customer Survey with more than 1,000 respondents across the country. The survey focused on the customer’s perspective on the current state of utility customer service and offerings. There are some tracking questions from prior years to provide trends analysis. As importantly, the survey included new questions to explore new dimensions or offerings, e.g., residential solar or electric vehicles, which may appeal to specific segments of customers. The survey also included reconfigured questions on net promoter scoring to compare more easily the utility sector to other sectors.
This year’s findings represent an improvement from last year’s Annual State of the Customer Survey. The utility sector has worked hard to support better customer experiences and to make it easier for customers to interact with utilities. The efforts of utilities have paid off in the form of higher customer satisfaction this year. Yet, the adage, “the past is not prologue,” is especially true for the future of the utility sector.
The survey findings represent a crossroads for utility customer service. While the utility sector is strong on the basics of customer service, many customers are seeking for their utility to be a leader on climate change and take more pro-active steps to support their desire for renewable energy and electric vehicles.
Improved marks for utility customer service
In 2018, a majority of customers gave high marks for their utility’s customer service with a slight increase from 2017. Fifty-six percent of the respondents gave high marks (top three boxes on a 10-point scale) when asked to rate their utility’s customer service. This represented an increase of 3 percent from 2017. Older Americans (55+) were especially pleased, with 72 percent giving high marks as compared to 50 percent of younger Americans (>55+) giving high marks.
Customers describe their utility customer service in positive terms. When asked for a one-word description, “good” was the word most often used followed by “great” and “reliable.”
For those customers who contacted the utility directly over the past two years, 74 percent of the customers found the experience to be “easy.” Forty-four percent responded “very easy” and 31 percent responded “somewhat easy.” This compares favorably to ease-of-use ratings from other industries. The 2018 findings represented a sizeable increase from 2017, 74 percent (2018) vs. 68 percent (2017).
Customers felt that their local utility provided better or equal value to most of the comparable service provi-ders, e.g., mobile or Internet. When comparing the value provided by their utility to other comparable service providers, respondents felt the utility provided a better value compared to other service provides except for cable and telephone provider. This is the first time that cable and telephone providers have scored better on value provided than utilities.

Customer perceptions of utility value and reliability
What could utilities do to increase customer value? By far, customers would appreciate lower prices or other ways to lower their utility bill. When asked an open-ended question on how utilities could be a better value to the customer, 54 percent of the respondents pointed to lower prices. Only 10 percent of respondents pointed to reliability or managing outages.
Customers are satisfied with the level of reliability provided by their utility. Seventy-one percent of respondents were highly satisfied (top three boxes), and 26 percent were somewhat satisfied.
If given a choice, three out of 10 customers would choose a $10 gift card over having their power restored in 60 minutes or less. This question was changed from last year’s survey, which referenced 30 minutes or less. Perhaps, not surprisingly, the number of customers choosing a gift card went down 11 percent when the outage was potentially longer (See Table 1).
Choice of Getting Power Back on 60 Minutes Sooner vs. 60 Minutes Later
Along with a $10 Gift Card at their Preferred Store.
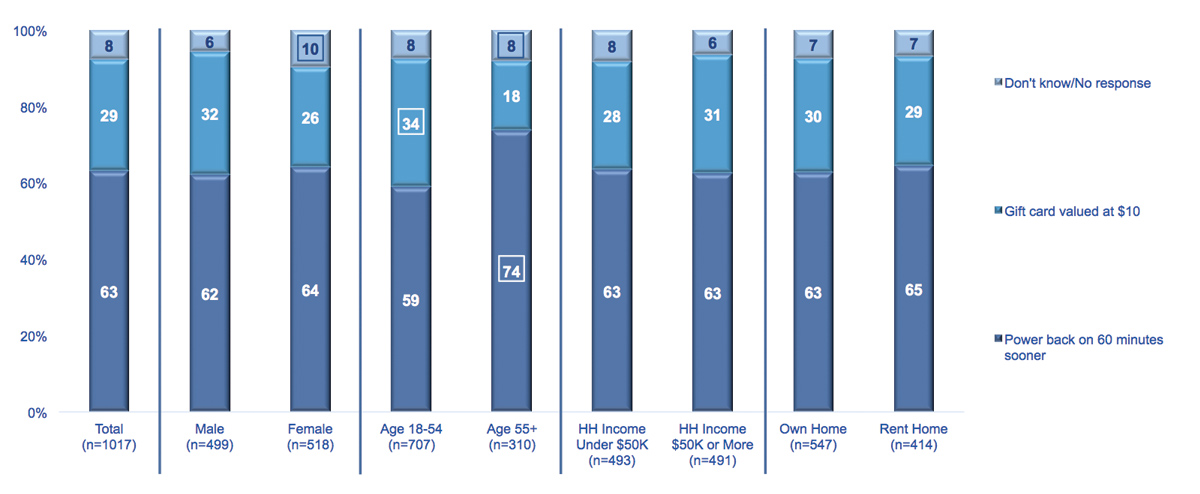
Table 1 Base: Total Respondents
Q. A9: If you had a choice of getting your power back on 60 minutes sooner during an outage or receiving a gift card from
your preferred store valued at $10 to restore your power 60 minutes later, which option would you choose?
(click to enlarge)
Choice of Getting Power Back on 60 Minutes Sooner vs. 60 Minutes Later Along with a $10 Gift Card at their Preferred Store.
Putting aside cost, a majority of customers would prefer to have a backup generator nearby, rather than waiting for the utility to restore power. Younger customers are significantly more willing to rely on a backup generator than older Americans (55+).
Only 24 percent of customers would pay slightly more for disaster planning for “hardening the grid” and increased reliability. Fifty percent of customers want to pay the same amount for the same level of reliability. Utilities could face opposition to rate increases based on a rationale to provide increased reliability.
Certainty is key
The 2018 survey findings point to customer demand for more certainty regarding service and pricing. However, a more segmented view of the customer base is required. There are significant differences especially between younger and older Americans. Consider the following findings:
- Only a slight majority of respondents (52 percent) believe their utility is prepared as a first responder for natural disasters. This points to the need to communicate your planning for such events.
- There was a significant dip in the percent of customers (62 percent in 2018 vs. 71 percent in 2017) that believe their utility provides the right amount of information.
- Seventy-eight percent of respondents, however, feel that the utility provides an adequate number of pricing and payment options; yet, 22 percent of customers would like more options. Younger Americans (>55 years old) in particular would like more options.
- Fixed pricing options or flat rates are the top choices for additional payment options, especially for lower-income consumers.
- One critical finding is that utilities need to move faster to provide mobile bill pay options. Almost half of the respondents believe it is either “extremely important” (22 percent) or “very important” (22 percent) to provide mobile bill pay options. This is especially true of younger Americans (>55 years old).
- There is high interest (35 percent in top three boxes) in automatic, recurring payments, especially with high-income customers. So, why aren’t more customers adopting this option?
The challenges ahead
A number of 2018 survey questions focused on the road ahead for utilities. The next couple of years will be challenging but also provide new opportunities.
The survey included a Net Promoter Score (NPS) question using the same question format as other sectors use (See Table 2). Any NPS score above “0” is considered to be “good,” meaning that the company has more promoters than detractors. Unfortunately, that is not the case for the utility sector, with an aggregate score of “-8.3.”
NPS recommendation likelihood ratings
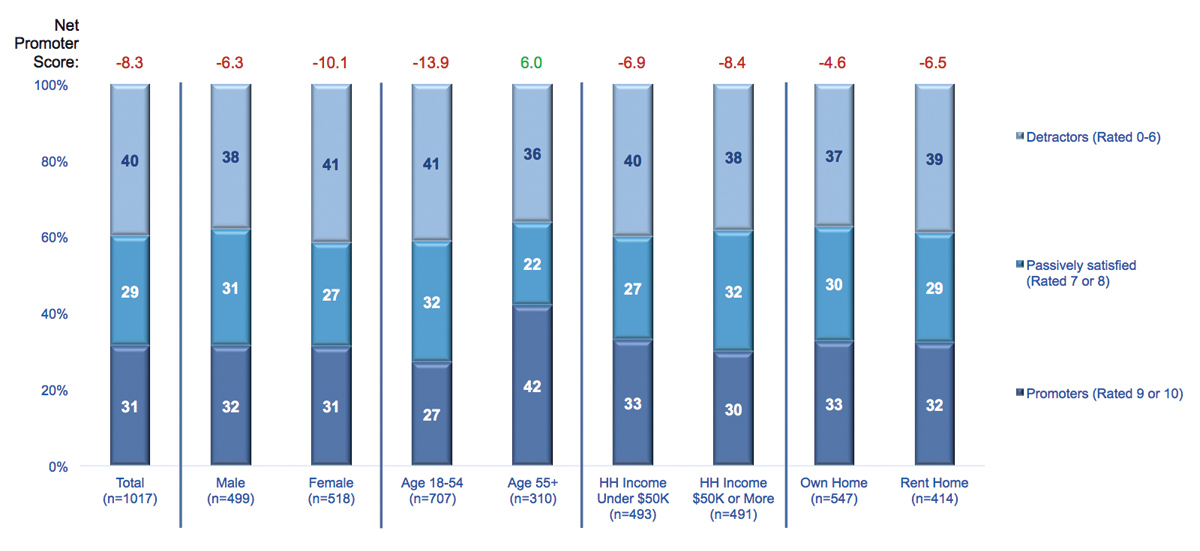
Table 2 Base: Total Respondents
Q. A18: Based on your experience, how likely would you be to recommend your local utility to family or friends? Please use a scale of 0 to 10,
where 0 means you are Not At All Likely to Recommend, 5 means you are Neutral, and 10 means you are Extremely Likely to Recommend.
(click to enlarge)
Customers are keen (51 percent in top three boxes) on having their utility be a leader on climate change.
Putting aside cost, customers are very interested (43 percent in top three boxes) in owning or leasing solar at their homes over the next two years.
Putting aside cost, customers are also interested (28 percent in top three boxes) in purchasing an electric vehicle over the next two years.
Customers interested in either buying solar power or an electric vehicle expect a different and better customer experience than your traditional customer service model, with 32 percent of respondents expecting to need more assistance or customer service than they receive now.
The kicker
While utilities had high customer satisfaction and compared favorably to other service providers for the customer value that they offer, the kicker is:
Twenty-two percent of customers are very likely (top three boxes on a 10-point scale) to switch to a provider other than the utility as soon they can (See Table 3). Another 48 percent (four-to to-seven boxes on a 10-point scale) may consider it if the offer was right. This was especially true of younger Americans (>55 years old).
Likelihood to Choose A Different Electric Utility Provider
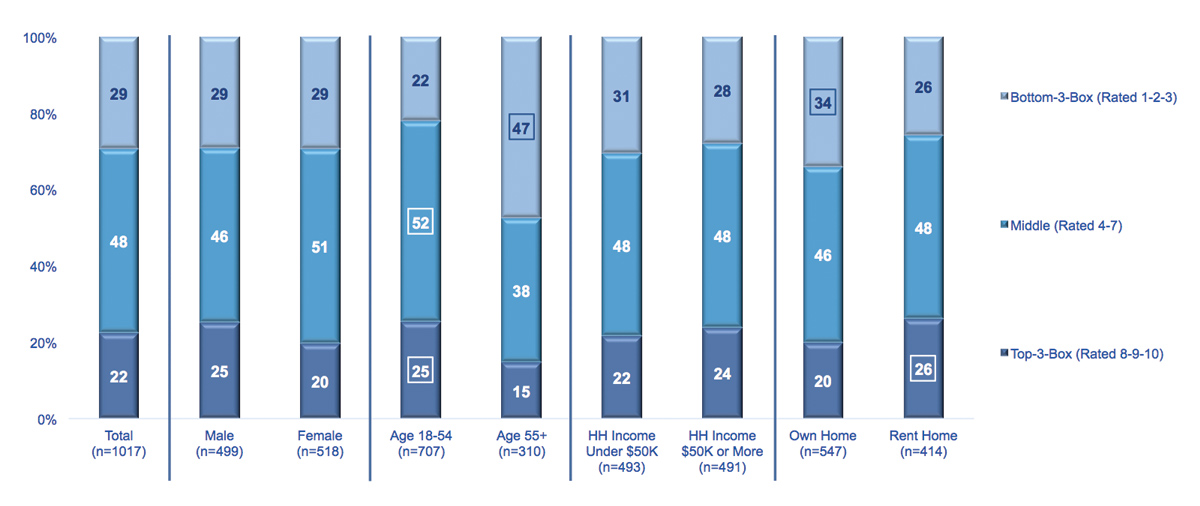
Table 3 Base: Total Respondents
Q. A23: If you had the ability to choose a different provider of electricity than your current electric utility,
how likely would you be to choose a different provider?
(click to enlarge)
Utility customer service at a crossroads
The utility sector continues to do well on the basics of customer service; however, there are growing signs that the sector is falling behind when serving certain segments of the customer base.
Probably the biggest divide facing the utility sector is a generational one. The 2018 survey findings consistently point to significant differences between younger Americans (>55 years old) and older Americans (55+) on their preferences and expectations on how they want to be served. In short, the utility customer service model is perfectly suited for the majority of senior citizens, and not so much for younger Americans. This generational gap is expected to grow even larger.
Bill pay is a good place to start to take a more segmented view of utility customer strategy. The utility sector needs to quickly pivot towards supporting the needs and preferences of younger Americans regarding utility bill pay. Requirements for a younger approach to bill pay would include: flexibility, incrementalism, optionality around pricing/ costs, real-time, and tied to larger value propositions, including societal. A strategy around mobile is of critical importance.
Bill pay offers an opportunity for the utility to tie together applications, e.g., high customer value or need, with segmentation to build engagement and customer value. Bill pay and smart grid data could be better aligned and leveraged to become transactional rather than just informational, e.g., alerts.
What are the right KPIs for utility bill pay? A more customer-centric, strategic view of bill pay would align utility bill pay with customer satisfaction, loyalty, and engagement through adoption of a broader array of offerings.
What do customers want regarding bill pay? The obvious answer is lower bills. What is not so obvious is f lower bills that more certainty, e.g., “no surprises,” would be greatly appreciated. And utilities can lower bills by reducing or eliminating fees. Fees are a source of customer concern and dissatisfaction. Changing policies in regard to fees won’t be enough without a communication strategy to signal that the customer bill is lower due to the change of policy.
A mission to improve customer service and bill pay for low-income customers is a win-win-win for customers seeking help, utilities seeking to reduce costs and increase c-sat, and regulators seeking to assure affordability.
It is possible to view the utility customer service model as a bifurcated one in the future. On the one hand, the utility will continue to improve its platforms and offerings to make routine transactions even easier, quicker and more seamless. Self-service enabled increasingly by artificial intelligence (AI) will be the norm.
On the other hand, there will be segments of customers who will require an even higher level of customer service and different customer experiences than supported today. The company that conducted the survey believes that the customer journey of solar customers and owners of electric vehicles, for example, is significantly different than your typical utility customer. These value-driven customers will likely represent the best opportunities for utilities to earn from excellent customer service in the future. On the other end of the economic spectrum, there are ample business, regulatory and moral reasons to change the customer service model to better assist low-income customers.

Jamie Wimberly has served as CEO of the Distributed Energy Financial Group LLC (DEFG) since it was founded in 2003. DEFG LLC is a management consulting firm in the utility sector focused on all aspects of customer strategy and operations. The Annual State of the Customer Survey can be downloaded at no charge at www.defgllc.com