
The business case for AMI deployment has often been made palatable to the regulators on the basis of widespread business benefits for the utility and the ratepayer. While present deployments have mostly just replaced the traditional ‘dumb' meter to serve its original purpose, as a cash register, much of the collected data remains to be exploited. This data may be used, readily in most cases, in a variety of applications benefitting distribution operations, planning, and management of utility distribution assets. When combined with data from other sources, one may develop unique insights into the power system, its comprising assets and their workings. Data driven asset management is the key to realizing the full benefits of AMI deployment.
Asset Management for the Distribution System
Asset Management is the science, and art, of making the necessary financial investments in the grid to either sustain, or improve, an observed level of performance. From an electric utility’s perspective, asset management is a broad topic area which includes generation, transmission and distribution assets. This article remains focused on the applications of Asset Management for the distribution system.
Distribution asset management helps utilities achieve the best return related to the performance of the individual assets comprising the distribution system. Typical measures for distribution asset performance include:
- Availability - expressed in terms of time on an annual basis
- Failure rate or frequency of failure - on an annual basis
- Mean time for repair/replacement
- Mean time between (or to) failures
- Outage costs – including loss of revenue, repair/replacement cost and societal costs
The computation of these performance metrics is based on historical data, which is often incomplete, inaccurate or strewn across the utility enterprise in multiple databases in a variety of formats. Current utility practices require regulated utilities to report metrics on a system wide or regional, as opposed to individual assets, basis. As a result, very little meaningful, or actionable, intelligence may be obtained about individual assets. In many cases, a high percentage of the outages are recorded with a cause code of ‘unknown.’ This leaves much to be desired in terms of asset intelligence.
In asset management, the key questions to ask have to do with the identification – and location – of problem assets, the nature of the problems characterized by their performance (reliability, overloads etc.) and the various data sources to access to develop a comprehensive understanding of the health of individual assets comprising the power system. The investment philosophy is based on undertaking suitable actions – repair, refurbish, replace – based on asset condition while minimizing associated failure risks. ‘Run to failure’ is an acceptable and widely used maintenance strategy for assets of low criticality although there are no uniform or universally accepted definitions for criticality.
To be most effective, Asset Management must be based on sound engineering knowledge, financial expertise and a solid foundation of data analytics. Investment decisions must be justifiable, repeatable, and consistent.
Distribution System Data Analytics
The distribution system plays a vital role in the energy value chain as it forms the last-mile and final link to the customer. It is also the part of the system that has the highest losses (both technical and non-technical, i.e., theft), the most number of discrete components (making it difficult to model for analysis) and the highest number of reliability issues comparatively (measured in terms of frequency and duration of outages). With ongoing efforts for AMI deployment, the distribution system will also have the most data based on the number of sensors deployed, customer counts and the granularity of measurement in each case. With the growth of distributed generation resources connected to the distribution system and resulting two-way power flows, there is no doubt that the distribution system will also see the most change in its intended design and future use.
Traditionally, the distribution system was scarcely monitored, mainly due to technology cost and need considerations. However, with the cost of sensors and IEDs dropping and the deployment of AMI, the distribution system has the distinction of generating ‘Big Data.’1 AMI data typically consists of interval data (at a specified rate of sampling, typically at least hourly for revenue collection purposes) of demand (kW) and other event data for a given customer. The Meter Data Management System (MDMS) hosts meter data from all customers in a central location for use in mainly revenue oriented applications (billing, settlement, etc.) for now. This data could be leveraged further to applications to describe present conditions and make predictions about the power system.
AMI data may be further leveraged by combining it with other sources of data – topology, for example – to gain unique insights. By aggregating data from a set of customers who are all served by a common distribution transformer, for example, it is possible to make inferences about the transformer’s performance. It is also possible to compute flows – and hence overloads and other reliability metrics like availability and number of failures in a given time interval and garner intelligence into the asset’s operation and condition. The data may be used to measure and benchmark asset performance with the objective of determining asset health, which in turn, could be combined with asset criticality to establish a measure of risk to guide asset investments. In short, AMI data, in combination with other data may be used to effectively implement asset management at the distribution level. These other sources of data could include SCADA data (historical operational data), maintenance data (including inspections), vendor catalogs, benchmark data, outage data, DMS and distribution automation (DA) data, and data from on-line condition monitoring.
Three key opportunities to utilize AMI data for distribution asset management include:
- Distribution Loss Analysis
- Distribution Transformer Monitoring and Health Indexing
- Complete Feeder Reliability Analysis
These opportunities look outward from a substation and focus on losses, loading and reliability based on available AMI data measured at the customer service delivery point(s), yielding considerable ‘bang-for-the-buck.’ Table 1 describes these applications and their data requirements at a high level.
| Opportunities to Use AMI Data |
Description | Additional Data Utilized* |
| Distribution Loss Analysis | Identify trend of loading on feeders, analyzing potential breakdown of theft and line losses (Where, How much) and notify user. | Distribution SCADA or Pi Historian, GIS/CIM feeder connectivity, OMS or DMS operational data, CIS data, CMMS, Vendor Catalogs |
| Distribution Transformer Monitoring and Health Indexing | Compute, trend and notify user of excessive feeder and transformer loadings over time (Which one, How much, How long) | |
| Complete Feeder Reliability Analysis |
Track, trend and predict feeder reliability using asset health indicators for key feeders |
*SCADA = Supervisory Control & Data Acquisition; CIS = Customer Information System;
CIM = Common Information Model; GIS = Geographical Information System;
OMS = Outage Management System; CMMS = Computerized Maintenance Management System;
MDMS = Meter Data Management System; DMS = Distribution Management System
Distribution Loss Analysis
Losses resulting from technical and non-technical causes are an important issue in distribution systems. Calculation of technical losses is difficult due to inconsistencies in distribution system modeling, load profiles and their associated granularity. Typically load profiles are constructed based on assumptions and limited data (typically measured at the substation or feeder head). AMI data can help in developing improved load models.2 These improved load models could be used in a load flow program to calculate the technical losses on a highly granular basis – say, every 15 minutes – and then aggregated suitably to provide a measure of losses on a monthly or annual basis. These losses may then be compared with losses calculated from revenue calculations using AMI data. The comparison when done on a granular basis – per feeder, for example – can help identify the location and amount of loss.
A visual description of how AMI data may be used to compute feeder losses is shown in Figure 1 where feeder losses associated with a given substation are aggregated (over the time period of analysis) and displayed using a dark color (heat-map) on the electrical one-line diagram. Substations whose feeders have high losses are shown by the red dot in relation to other substations on a geographic map. Various levels of zoom are permitted along with a selection of layers for purposes of displaying different levels of granularity of the results.
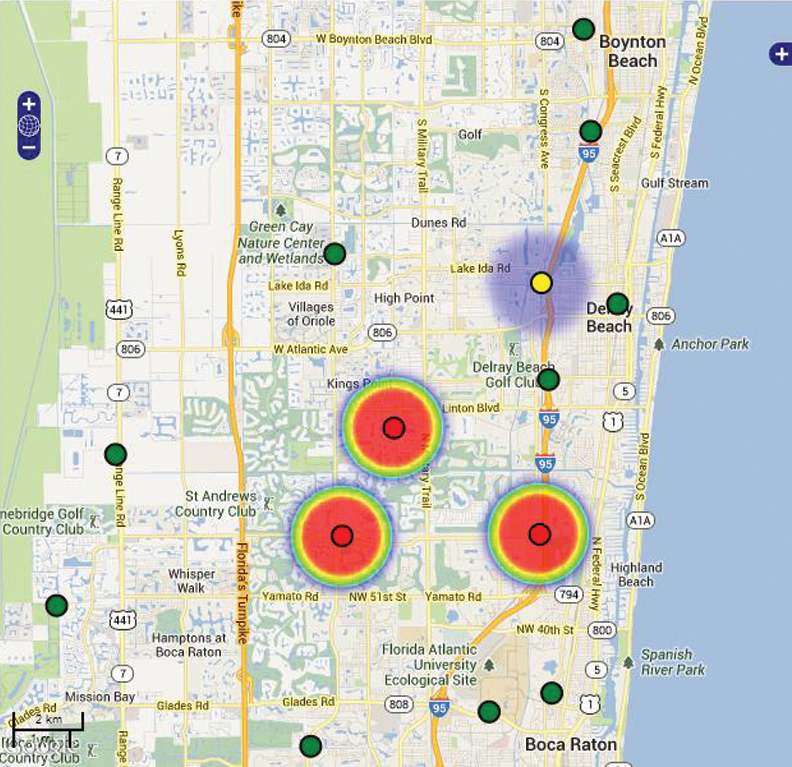
Figure 1. Feeder Losses Shown Using Heat-maps
(click to enlarge)
Distribution Transformer Monitoring and Health Indexing
Distribution transformer monitoring has been challenging in the past because of the lack of availability of sensory data at the right location. However, with the availability of AMI data and topological connectivity, it is possible to aggregate AMI readings in time across all customers fed off the same distribution transformer. The aggregated reading provides a measure of the true loading of the transformer. Comparison of the aggregated loading versus name plate readings then allows for the determination of frequency and duration of overloads – making it now possible to monitor individual transformers. Similarly, it is possible to establish outage statistics for a transformer based on AMI data from customers fed off that transformer.
Monitoring these transformers can provide insights into the pro-active actions that need to be taken. For example, a transformer that is overloaded all the time may need to be upgraded with one of higher rating either from the warehouse or just swapped with an existing transformer that is over rated for its present location. This shifting of capacity can ensure optimal utilization of assets.
Figure 2 displays transformer health based on the weighted average of frequency and duration of overloads over the analysis period. In the figure, transformers are shown using triangle symbols with their fill-in colors representing various heath ratings. Transformers with a health rating of ‘Good’ are shown in green, transformers with a health rating of ‘Moderate’ are in yellow and transformers that ‘Need Attention’ are shown in red. The tab on the far right shows the health index of the substation (0.52 on a scale of 0 to 1, lower values indicating worsening health), which is an aggregation of the health indices of all assets associated with it. On the far right bottom, the raw data associated with the selected transformer is shown. These data are used in the determination of the health index of the selected transformer (0.4479).
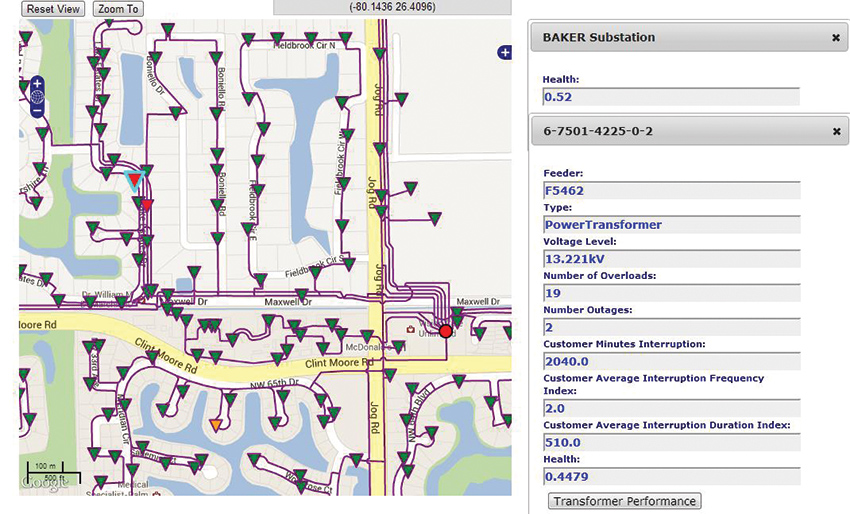
Figure 2. Transformer Health at a High Level
(click to enlarge)
Figure 3 shows the details of the transformer health index calculation. Overloads (number and duration) along with outage data (number and duration) are taken into account in the computation of the index that is a proxy for transformer health. The figure shows the summary for all transformers in the test power system.3
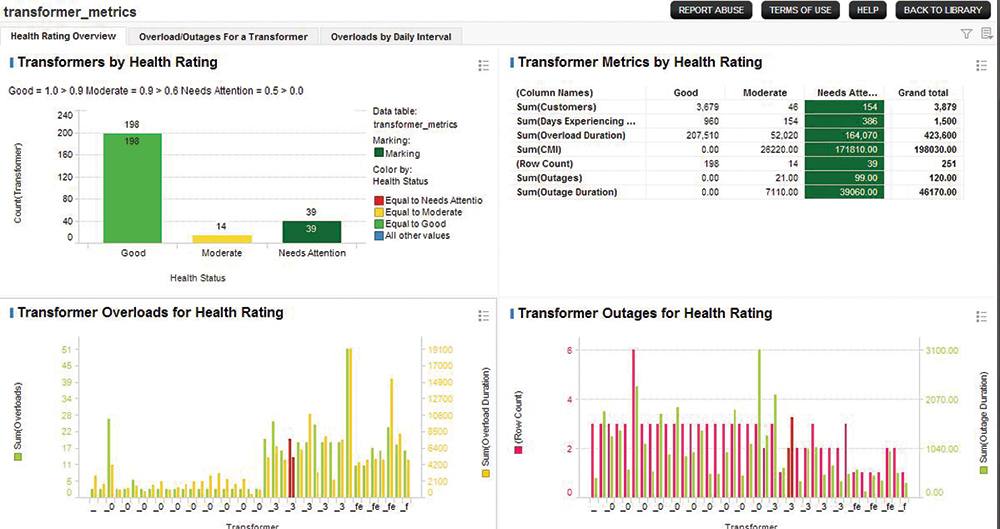
Figure 3. Data Visualization for Transformer Health Calculation
(click to enlarge)
Complete Feeder Reliability Analysis
With the availability of AMI data, it is possible to calculate reliability metrics based on frequency and duration of service interruption at the point of service/delivery. These metrics are a true measure of what the customer experienced in terms of loss of service in contrast to the numbers calculated by the utility, which is on a system wide basis, averaged across all customers. Likely, these AMI data based metrics will spur a debate on how reliability metrics need to be calculated.
By data aggregation, the metrics calculated at the service drop off may be used to calculate reliability metrics at the transformer level. These may in-turn be aggregated to calculate metrics for the feeder and the substation. Figure 2 above indicates the reliability of the transformer in terms of numbers of outages (2) and duration, i.e., 510 minutes (indicated by the tab in the far right, near the bottom), which accounts for a total of 2040 customer minutes of outages.
Using the same data aggregation logic, it is possible to calculate reliability indexes for the feeder. Clearly to accomplish this, the circuit topology must be known along with all the underlying AMI data. It is also possible to characterize feeders by risk of failure knowing their associated reliability and the criticality of the loads they serve. This prioritized risk profile could serve as a guide for trouble shooting, asset investments and predictive actions related to maintenance and/or asset replacement.
As a practical matter, it is important to identify and rectify data accuracy issues. These data issues, if left unresolved, could lead to unreliable results that might lead one to doubt the benefits of the AMI data mining efforts.
Lessons learned from past implementations show a threshold level of trust has to be reached before users adopt any new technology without reservation. Data analytics is no exception.
Closing
While AMI data serves the primary purpose of revenue calculation, it can serve multiple other purposes by itself. When combined with other data sources available within the utility enterprise, AMI data can provide unique insights into such areas as theft detection, loss identification, transformer monitoring, asset health indexing, feeder reliability calculation, substation ranking (by various criteria), and risk management. These insights can help utilities realize the full benefits of AMI deployment and other smart grid investments. Combining AMI data analytics with graphic capabilities provided by third party vendors, such as Google, for example, allows data visualization in a realistic sense. Calculations of various data analytics can be presented in the form of layers on top of a geographically based one-line diagram of the power system as shown here.
About the Author
 Dr. Siri Varadan, PE, is a Vice President at UISOL (an Alstom company), where he leads the Asset Management Practice. Dr. Varadan holds BS, MS and Ph.D. degrees in Electrical Power Engineering and specializes in asset management, data analytics and IT integration for electric utilities with a focus on T&D systems. He is a senior member of the IEEE and a member of the Institute of Asset Management.
References
1 Per the Forrester et al definition, big data is characterized by the four Vs – Velocity (speed at which data are being accrued, Variability (subject to multiple interpretations), Variety (in the number of possible formats, and Volume (amount of data that needs to be stored, sorted and searched).
2 AMI data will play a large role in accurate determination of loads in the light of anticipated two-way flows in distribution feeders as a result of increasing levels of penetration of distributed generation sources.
3 The test power system is the IEC-61968 test power system. AMI data was simulated based on customer profiles and system characteristics. The simulated data included outages and overload conditions to reflect realistic operational conditions.