
An innovative aerial survey utilising LiDAR technology and PLS-CADD™ software has been successfully deployed in the Indian electricity transmission sector for the optimisation of 1,900 circuit kilometres of 765 kV overhead lines (OHLs) that run across mountains, plains and urbanised areas. Network Mapping, a UK and US based aerial LiDAR service provider, performed the survey work as a consultant to Jabalpur Transmission (JTCL) and Bhopal – Dhule Transmission (BDTCL), owned by Sterlite Grid Limited, an innovative Indian engineering firm at the forefront of the power transmission infrastructure sector. The purpose of the project was to assist with two 35-year Design-Build-Operate concessions by employing LiDAR technology to optimise route corridors for planned transmission lines to maximise load transfer capacity and reliability and minimise construction costs and delays. The project attracted commentary from the Chancellor in the UK and the Finance Minister of India as a demonstration of improving Anglo-Indian initiatives. This article describes the project, the unique challenges faced in India, and the results of the LiDAR and PLS-CADD™ optimisation process.
New infrastructure for India
India is currently engaging in large scale investment in its transmission infrastructure with 109,000 circuit kilometres to be designed and constructed as part of the 12th 5-year plan (2012 to 2017). This level of investment is required to meet the huge increases in demand created by growth of the industrial and population bases together with rising living standards. Gross Domestic Product has increased by 7.7 percent between 2007 and 2011, and the population by 1.76 percent per year from 2001 to 2011. Black-outs and brown-outs are common; six hundred million people were left without power in July 2012 following the cascading failures of the northern, eastern, and north-eastern grids.
The concessions for the new-build projects that form the topic of this article were comprised of five single circuit lines and one double circuit line at the 765 kV level. The six concessions crossed mountainous terrain, flat plains, and large rivers in five states of Central India. These States, from west to east, incorporated Gujarat, Maharashtra, Madhya Pradesh, Chattisgarh, and Jarkandh.
Against this context it was crucial for JTCL and BDTCL to design new Over Head Lines (OHL) for their concessions that would provide extremely high levels of both utilisation and reliability in a cost effective solution. This necessitated deployment of the very latest technology. Aerial LiDAR survey techniques and PLS-CADD™ software were chosen by Sterlite to fulfil these objectives.
“It is a matter of great pride that Sterlite Grid becomes the first organization in India to undertake and accomplish an aerial LiDAR survey as a part of the construction of its Transmission Line assets,” remarked Pratik Agarwal, Director, Sterlite Grid. “All the tower spotting concerns are known prior to construction itself and resolved thereby helping in faster project implementation and lesser provision for contingencies.”
The process
Capturing data using aerial LiDAR technology – the benefits
Aerial LiDAR technology is a rapid survey technique that has been employed extensively to assess electricity transmission infrastructure throughout the world. Digital 3D models are created by emitting laser points, generally from a helicopter acquisition platform. Only one technician is required to operate a base station within each 20 kilometre radius of the survey platform. The technique allows comprehensive data of a high resolution to be captured quickly, with typical point densities being in excess of 20 points per square metre. Provided there is adequate ground control, the absolute accuracy of a single point will be of a high level and the relative accuracy between points will be even greater still. The high resolution of survey points captured by the system allows the ground surface, man-made and natural features to be adequately mapped to ensure regulatory clearance is met for the new line design.
The speed of data capture as compared to conventional surveying is one of the major benefits of a LiDAR survey. Typically, data capture progresses at a rate of 60 kilometres per day. For Sterlite’s survey, data for the entire 1,600 kilometres of transmission lines was captured in 20 days (a higher than average capture rate of 75 kilometres per day) and processing was completed within 3 months. The difficult terrain encountered would have posed significant obstacles to a traditional survey; due to the aerial nature of Network Mapping’s survey, however, this was much less of a problem. Conducting a survey from an aerial platform also avoided issues of inflated land compensation claims that can sometimes arise when ground surveyors have a prominent presence in an area.
Aerial LiDAR surveys allow a greater survey width to be captured in a short space of time as compared to conventional surveying. This is of particular benefit to route optimisation, as a wider survey swath allows such options to be assessed using the survey-derived data. This attribute of Network Mapping’s aerial LiDAR survey provided benefits to JTCL and BDTCL, as one challenge that had to be tackled were powerlines that crossed tribal villages and schools along the Dharamjaygarh to Jabalpur route. Tribal ethnicities and their relationship with the wider Indian population and government is a sensitive issue in India, requiring Network Mapping to re-align these routes using the LiDAR data so that such areas and issues were avoided.
The process
Challenges to data capture
India presented its own unique challenges to data capture. Initially, importing the equipment into the country proved problematic, with customs procedures taking a long time. The varied and difficult nature of the terrain proved a challenge for ground crews as road conditions sometimes inhibited travel and logistics. As well as this, the time taken and difficulty of obtaining landing and take-off permissions hindered proceedings slightly. This was mainly due to difficulties in locating regional airfields to gain such permissions. Despite these obstacles, the data capture progressed smoothly and quickly, displaying the versatility of the methodology and the ability of Network Mapping and Sterlite to work together to address the various procedural compliances that were required prior to flying.
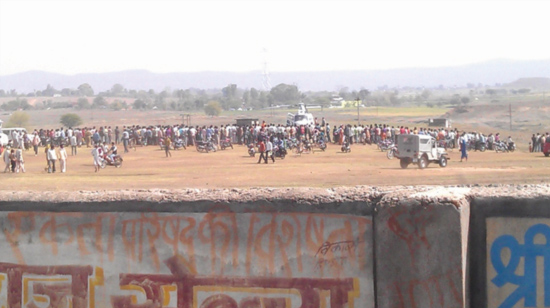
The aerial LiDAR system lands in rural India, attracting a crowd.
Data processing
The LiDAR data is imported into PLS-CADD™ as a classified point cloud. Using this data, models can be created in PLS-CADD™ to assess various criteria in relation to the new-build lines, which can inform on the best options for alignments, tower designs and tower positions, in order to produce a least cost solution. Such models can compute and balance cost against the reliability and performance of lines, thus producing a route which is both cost effective and in accordance with regulation.
“We’re very grateful to Sterlite Grid for giving us this opportunity,” said David Langworth, Chairman, Network Mapping. “This seminal project demonstrated that LiDAR data is now available in India and when combined with PLS-CADD™ provides an invaluable technology for the development of overhead lines. This has opened the opportunity for aerial LiDAR to be used in support of India’s rapid infrastructure growth and to deliver utilisation and reliability improvements to existing grid infrastructure.”
Outcomes of the approach
Optimisation of route alignments can provide many benefits to engineers. Modelling calculates the most appropriate, lowest cost solution that can overcome obstacles in the landscape. The swath width of the survey enables alternative horizontal alignments to be explored. The main obstacle for Sterlite, however, was the terrain, which meant the focus of this optimisation was the vertical alignment. With PLS-CADD™ modelling, it could be determined prior to construction which tower designs and positions would cross valleys, hilly terrain, and rivers in the most cost effective manner, whilst still meeting all structural and clearance regulation.
Specific examples of optimisation providing benefits to cost, reliability, and schedule abound within this project, including:
The process
Reliability
The terrain of the powerline routes presented the main obstacle to JTCL and BDTCL’s construction. Hills, mountains, and large rivers meant that a standard suite of tower designs would not provide as reliable a service, due to these landscape features compromising the effective operation of such structures. Thus many different and more specialised tower designs needed to be employed for proposed towers to ensure that ground clearance distances were maintained. The Jabalpur to Bhopal route provides an example of this, as the hilly terrain required larger and stronger towers than was originally anticipated. PLS-CADD™ modelling also enabled the design of special uplift towers in order to cross a mountain and large rivers along the Dhule-Aurangabad route in a manner which did not compromise the ground clearances of the lines. The ability of aerial LiDAR survey to overcome such topographical difficulties ensured an increased level of reliability for the power lines, as the optimised tower designs and positions reduced the number of structural and clearance violations within the network.
Cost and Schedule improvements
The highly accurate and detailed nature of the data allowed the project to be planned effectively, saving time and money. The survey optimised the route design which resulted in 22 fewer towers being used, thus reducing the Bill Of Quantities (BOQ) for the project. Because site conditions could be studied in the desktop, no check surveys were required and construction delays were minimized. Health and safety benefits can also be realized in the same manner. These attributes improve cost effectiveness and reduce risks to field crews by nullifying the need for sending personnel to the site for such checks in potentially hazardous areas. Schedule times can also be improved due to the fact that the information required is already at hand, meaning no extra time needs to be spent on gathering information. End-to-end costs were also reduced as any design modifications could be completed before construction commenced.
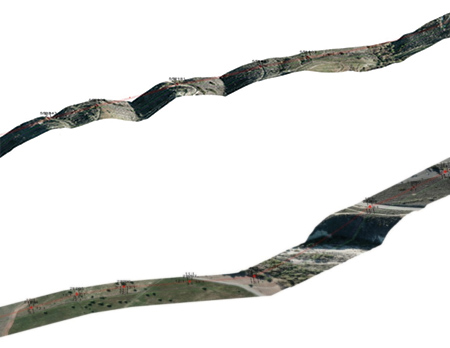
Stock imagery examples of PLS-CADD™ modelling which enabled the crossing of features,
such as wide river valleys and human settlements
“The availability of this highly detailed and accurate aerial LiDAR corridor mapping prior to the detailed design phase of this project is like providing the perfect race track for a finely tuned supercar to push all of its capabilities to the limits,” stated Otto J. Lynch, P.E., Vice President of Power Line Systems, Inc. “The cost savings and engineering confidence over traditional surveying and archaic line design methods is immeasurable. We at PLS are proud to continue to be a part of providing a complete and modern engineering solution that delivers both an economical and reliable solution to the grid development in India.”
LiDAR has improved reliability, cost effectiveness and scheduling for OHL design work in India
This project commissioned by Sterlite and executed by Network Mapping has demonstrated that LiDAR survey and PLS-CADD™ are feasible tools that are now available for use by design engineers in India. The technology enables new overhead lines to be designed in such a way that reliability, cost effectiveness, and scheduling are maximised. A natural extension to the value that this technology can offer to the Indian transmission grid is to demonstrate application for the as-built survey of existing transmission lines to check clearances and mitigate violations to prevent future black-outs.
About the Author
 Paul Richardson is Network Mapping’s Engineering Director. He has over 30 years’ experience of working for, and with, Power Utilities in Europe, the United States, the Middle East, India, and Australia. Paul has worked extensively on new build and existing T&D assets and has spearheaded the use of LiDAR in reducing capital spend, improving reliability and increasing utilisation. www.network-mapping.com