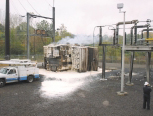
After a 230 - 35 kV substation transformer failed at PECO Energy Company (PECO), a subsidiary of Exelon Corporation, engineers evaluated all the available data for the transformer and realized that if they had easier access to all the same data a week before the event and had advanced maintenance practices in place, they could have saved that transformer. John Baranowski, the Manager for System Operations Planning became doubly committed to the project since it was the transformer that fed his neighborhood, and the outage occurred during a Philadelphia Eagles game. Since this time John, in a new role as an IT Business Specialist, has helped PECO in its efforts to move from a time-based to a condition-based maintenance program as part of PECO’s Equipment Health System (EHS) project sponsored by the PECO Transmission and Substation Group.
One of the key applications that the EHS project has developed in a short period of time is a way to view all substation transformers from a single display using real-time or historical data; the second application uses the same application environment, but utilizes the IEEE transformer loading calculations which predict the maximum top oil and hot spot temperatures. These two simple applications provide so much value that many utilities have asked how they might do the same. Following are details about how this was accomplished.
Transformer Health Display
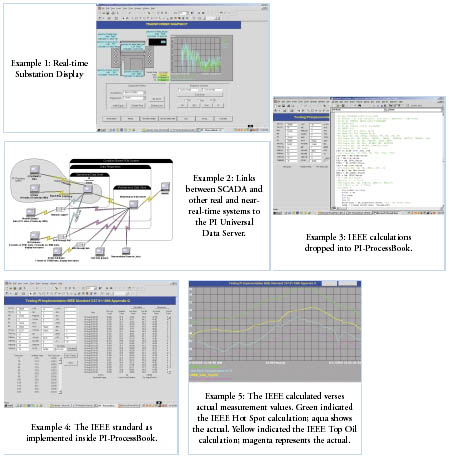
Rather than create a single display for all substations, the EHS project team decided to create a single display for all transformers with real-time updates for all available data for the transformer. Example 1 is the view that an engineer sees from any desktop within the organization. All substation transformers (upper left) are represented by a single transformer symbol. The aqua blue boxes show real-time measurements for that transformer. The measurement values have fixed locations. If there are no data values for a particular measurement, the measurement box will be blackened. In the example, transformer hot spot temperature is not available for this particular transformer.
To view a particular transformer, an engineer first selects the substation and then selects a transformer for that station (lower left). Real-time trends for tap changer and oil temp temperatures are located in the upper right area; and the ability to select a different time frame to view the snapshot (the whole display) is located in the lower right. Ad hoc trends are added to the display by clicking on the appropriate aqua blue box. The application was built using PI-ProcessBook (PB), a client application that is part of the PI System from OSIsoft. The client application signs up for event notification from the PI-Universal Data Server (UDS), which contains real-time and historical operating data. Real-time data are collected by the PI-UDS from a couple real - and near-real-time applications such as Supervisory Control and Data Acquisition (SCADA) and substations. Example 2 shows the various links between PI-UDS and the source systems. Once the data are in PI, any application or user has access to real-time or historical data. The link leaving the UDS goes to the Cascade maintenance management application from Digital Inspections. PECO will bring this connection on-line once the interface between the two applications is complete. PI can then be set up to communicate specific alarms and conditions to Cascade.
PI-ProcessBook (PB) has a few capabilities that made this application simple to execute. Real-time trending and measurement values are part of the generic tool, as are playback, dynamic graphics and ad hoc trending. PB also has embedded Visual Basic for Applications (VBA) that allows more complex applications to be rapidly developed. VBA was used to create the pull down lists and snapshot selection. In the center of the transformer display are three boxes that dynamically indicate the value of the last sample test for transformer oil, including dissolved gas analysis (DGA), PCB concentration in the oil, and general oil quality results. Results and analysis for this data are stored in a separate database from Doble Engineering; a simple ODBC query is initiated by PB to access the results from the Doble tests. The query is automatically built based on the selected snapshot values.
If the top oil temperature is a little high, but the oil test reading is good, then there is less worry that the transformer needs immediate maintenance than when the oil temperature is high and the oil test is marginal or poor. Engineers know to prioritize the maintenance based on actual loading conditions and previous diagnostic test results. The ability to postpone the maintenance until the next planned outage minimizes the cost of the outage, and the associated impact on available transmission for bulk power transactions and/or ability to serve customer load. The PB display allows the engineers to continue to monitor equipment that may have some postponed maintenance to see if equipment conditions are degrading, and therefore require advancing the maintenance to avoid the impact of an unplanned outage or equipment failure.
While most substation SCADA systems provide a generic alarm for a transformer, few systems have the capability to let the dispatcher know what condition is that triggers an alarm or the priority of the alarm. Now anyone can look at the PI data to help diagnose the problem, and determine the appropriate response. PI has a number of tools to alarm and page engineers for immediate attention. Once Cascade is in place, generation and prioritization of work orders will be automated. Also, using the newly released features in PI, the display could be exported to the web using the Scalable Vector Graphics (SVG) export option within PB, and then used the .NET environment to perform some of the VBA functions, and make the results available on the company intranet.
The IEEE Guide for Loading Mineral-Oil-Immersed Transformers (IEEE C57.91 Standard)
The IEEE Guide for loading mineral-oilimmersed transformers contains guidelines as well as example code for temperature calculations in the back of the standard (Appendix G). Because PI-ProcessBook has embedded VBA, this code was easily dropped into PB. Areas that were unimportant were commented out. Example 3 depicts how the code was dropped into PB and Example 4 shows the final PB display. This display was created using the same environment as the transformer view.
The upper left area of Example 4 presents realtime calculations; the bottom left indicates of the real-time values from PI-UDS and the right hand side shows the resulting IEEE calculations for each hour based on actual transformer loading and outside temperate. If the actual transformer temperature is much lower than the predicted (calculated) temperature, the thermostat for transformer fans may be stuck, and the transformer could be at risk for failure due to static electrification. If the actual temperature is much higher, the fans may be failed, or radiators may be clogged which could result in failure due to thermal overload even though the transformer may be loaded below its nameplate rating. This display can be viewed for any date and the information is automatically recalculated on the fly. It could also be used to validate assumptions used for static ratings, or to develop a dynamic transformer rating.
Example 5 is the resulting trend of calculated versus actual for a twenty-four hour time period. As mentioned before, there are various options for generating alarms. PI has alarm tags that are based on limits; or a PI-Process Template could be generated for a particular signature and current values would be compared against the template. The value would either be in compliance, or result in a low- or high-level alarm. There is a final option to use the PI-Advanced Calculation Engine (ACE) to generate alarms based on a calculation that may vary depending on equipment type, location, or condition.
Summary
One of the reasons PECO originally selected the PI System was because nine substations had produced nine billion measurement values per year at a 10 second scan rate and no relational archive could handle this. In addition, since PI stores data based on exception thresholds, it ensures that all unusual system data will be captured in the archives. Once PI was installed, they began to work with the client tools and discovered that there is a lot more a utility can do than just archive information and access it using traditional means. Every piece of equipment has a signature for failure. Without operating condition-based data, true maintenance management cannot really occur. Without a way to efficiently access, manage, store and easily manipulate these data, PECO would not be on the road to achieving their maintenance goals.
These are two very simple applications that extend the capability of simply having archive capability and that there is still so much more that can be done. PB with its VBA integration provides a rapid development environment which can be used to quickly prototype ideas, and get user feedback to enhance the usability, or link to other data sources to help turn the huge volume of existing real-time SCADA data into actionable information. The use of PB has helped the PECO EHS project team to refine its vision, and enhance the final deliverables.