
Introduction
The effect that weather can have on service interruptions and the ability of an electric utility to consistently deliver energy to its customers is well known. The generation group is mostly concerned with forecast weather conditions. Their requirement is to know how hot or cold it’s going to be today and tomorrow in order to efficiently manage the production and generation of energy. The non-regulated marketers also monitor forecast weather so they are prepared to buy and sell power due to fluctuating demand, often driven by weather conditions. Meanwhile, transmission operations are on the lookout for adverse weather conditions such as lightning, severe storms and winds. If there is weatherrelated damage, or potential for damage, the transmission engineer must be prepared to reroute energy or dispatch repair crews to return the grid to full operation. Finally, the distribution operations group monitors weather information, such as radar and lightning data, to manage field crews. As storms move into the service area, dispatchers need to know where to be prepared to direct repair crews and whether or not to pull them off jobs or put off-duty crews on standby. New storm tracking technology introduces the ability for an electric utility to monitor dynamically developing severe weather storm cells for much improved and more efficient decision-making.
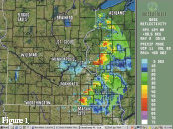
Figure 1. Example of weather radar display from a single site. Broad areas of precipitation are depicted combined with a geographical map, with varying levels of precipitation intensity corresponding to different colors.
It is now possible to track the current and future locations of individual storm cells relative to an energy organization’s assets in real time. This “Active Storm Tracking” capability is now available for use by electric utility organizations within the United States. A result of the merging of the latest generation of Doppler weather radar systems, advanced meteorological algorithms, and Geographical Information System (GIS) software, the automated and timely reconnaissance of small-scale weather features can now be realized. Operational use of this new technology could significantly enhance a utility’s capacity to track a wide variety of potentially severe weather events,and evaluate their potential near-term effects. The result could mean the difference between a temporary service interruption and a lengthy one that might negatively impact customer service.
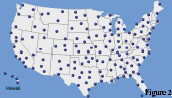
Figure 2. Locations of NEXRAD radar sites
Weather Radar
The weather radar technology being used today in the United States has evolved substantially since the discovery of weather signatures on military radars during World War II. Since then, the evolution of electronics technology, coupled with a better understanding of atmospheric physics, has led to steady improvements in the ability to sense remote precipitation from radar.
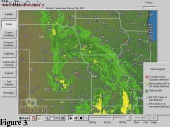
Figure 3. Example of mosaic weather radar image
Starting in the early 1990’s, the National Weather Service (NWS) began to deploy a national network of new Doppler weather radar systems. Code-named WSR-88D (Weather Surveillance Radar 1988-Doppler), they have come to be commonly referred to as the NEXRAD (Next Generation Radar) system. With a maximum range of more than 240 nautical miles (primarily limited by physical characteristics of radar beams curving away from the earth’s surface as distance increases), the NEXRAD network of more than 150 systems can monitor most of the United States with a contiguous 1-kilometer spatial resolution.
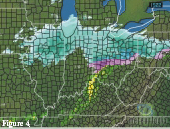
Figure 4. Example of radar mosaic with location, intensity and state
NEXRAD radars have two distinct advantages over older radars. First, they are Doppler radars, which means that the radar can calculate the velocities of raindrops within storm cells. Second, they scan the entire volume of space above the radar (literally a cylinder 240 miles wide and 80,000 feet tall), producing one scan every five to 10 minutes, depending upon the precipitation detected. The combination of these two characteristics allows a NEXRAD radar to create a three-dimensional picture of precipitation, and to discern features such as individual storm cells, and even small phenomena such as tornados and hail.
Because of these characteristics, the use of weather radar within an energy utility, to infer the potential weather consequences of storms on their operations, continues to grow. Weather radar has become one of the most useful types of weather information used by transmission and distribution personnel within an electric utility because it provides an accurate depiction of where precipitation is occurring over large geographical areas as well as in specific locations.
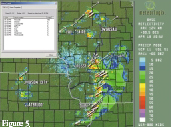
Figure 5. Example of mosaic weather radar image, with storm tracking and ETA information
Mosaic of a Network of Weather Radar Images
While individual radars provide good local information, a utility often needs information over a wider area. The establishment of an overlapping network of NEXRAD radars provides this expanded coverage. With a network of weather radars in place, the combination of multiple, overlapping, and time-synchronized weather radar images into a single image introduces additional value. But in order to do this effectively, non-precipitation entities in the weather radar image also need to be eliminated.
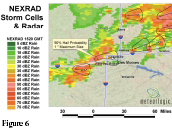
Figure 6. Example of weather radar, with storm tracking, within a GIS
The NEXRAD radars are very sensitive, so that they can effectively detect light precipitation. Although weather radars are designed to detect particles the size of raindrops, they also sometimes detect nearby objects such as high elevation terrain features, buildings and other ground features that intercept the radar beam. They sometimes detect birds, insects, and suspended water vapor particles. This “clutter” generally provides little usable meteorological information and may in fact introduce confusion in the interpretation of the radar display, as it is often difficult for a non-meteorologist to differentiate between the actual precipitation and clutter close to the radar.
To address this issue, a unique technique was developed that utilized additional information from the NEXRAD, along with other current meteorological information, to suppress or eliminate clutter areas from the precipitation areas. The overlapping radar coverage allows adjacent radars to fill in clutter-suppressed areas if actual precipitation is indeed present. This innovative approach allows for the automated production of a Doppler weather radar mosaic image, essentially clear of clutter contamination. Considerable additional value is added by the automatic removal of radar ground clutter and other false radar signals. The resultant radar mosaic represents a depiction of actual precipitation, not simply raw radar echoes — a very significant difference.
National and regional weather radar mosaics are produced, representing all of the precipitation activity in the contiguous United States, every five minutes. The mosaic is based on the lowest elevation scan of the NEXRAD radar, which provides the best overall depiction of where precipitation is actually falling to the earth. A radar mosaic allows for more continuity when tracking organized grounds of storms traversing longer distances.
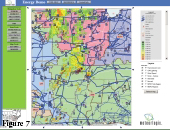
Figure 7. Example of weather radar and storm tracking merged with energy assets via Internet- and/or Intranet-delivered, browser-based client
Precipitation State
The weather radar mosaic was further enhanced with information on the precipitation state (liquid, frozen, or mix) integrated into the display. It allows the user to determine not only the location and intensity of precipitation, but also whether the precipitation is falling as snow, rain, or an ice mixture. This allows the tracking of large areas of snow and/or ice precipitation relative to service areas. This is of particular value to the dispatch operations group as an aid in determining potential outages due to ice accretion.
Storm Tracking Attributes
The NEXRAD radar introduced a new series of data sets making possible the automated tracking of individual storms. A series of complex meteorological algorithms identify individual clusters of storms, and perform a pattern recognition correlation on recent data to determine storm movement. Additional algorithms calculate the attributes of individual storms, including the likelihood of the presence of hail, damaging winds, and potential developing tornadoes. Using this information, it is now possible for utilities to pinpoint the precise location of a storm cell, where it is moving, and what assets it will affect, along with an Estimated Time of Arrival (ETA). Storms that are in a utility’s service area can be monitored and tracked in near real time since the radar data is updated every five minutes. Utilities can monitor speed and direction, intensity, presence and size of hail, and presence of possible tornadic activity. The integration of mosaic weather radar (with precipitation state information) and overlay plots of current and future storm cell locations has been accomplished and integrated into PC desktop display systems.
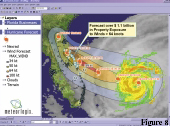
Figure 8. Example of hurricane tracking within a GIS
Storm Tracking and GIS
Storm tracking merged into a GIS further enhances value by integrating the geographical locations of the storm information with energy infrastructure assets. While GIS offers benefits to virtually every area of the utility, transmission and distribution operations benefit the most with regard to servicing the utility customer. Service area infrastructure (generation units, transmission lines, substations) can be mapped into the GIS and merged with real-time weather information. Smaller-scale weather events, such as storm tracks, can also be incorporated into a GIS and treated as just another data layer. With a weather-enabled GIS, engineers can pinpoint the exact location where weather-related service is required. This also introduces interesting prospects for spatial analysis that can generate automated alerts when threatening weather approaches strategic company assets.
The ability to have continuous real-time access to individual storm cells and their corresponding meteorological characteristics including speed and direction of movement, intensity, presence and size of hail, and presence of possible developing tornadic activity, in GIS-compatible data formats, is essential.
Storm Tracking, GIS and Decision Support Systems
Now a new GIS-based system can help utilities make more informed weather-related decisions. An integrated suite of real-time GIS weather data and software provides decision support tools for dispatch and transmission/distribution managers of utility companies. Weather data is collected from a variety of sources, converted to GIS format, and delivered to a utility’s network, allowing for the integration of the weather data with the utility’s own operational maps. The viewing and query of data can be accomplished within a browser via an Intranet or over the Internet. This new system is a customized, turnkey solution that is easy to use and tailored specifically to each utility customer.
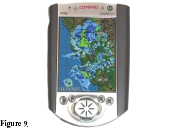
Figure 9. Example of single-site radar on mobile device
With this new technology, a user can determine how wide a buffer between company assets and severe weather is necessary for safe operation. Then, if lightning, ice, heavy rains or high winds enter that "safe" area, company decision-makers will have pertinent information in advance.
Tracking of Large-Scale Storms
Significant large-scale weather events, such as tropical storms and hurricanes, can also now be monitored directly within a GIS. The combination of weather satellite, weather radar, and forecast hurricane tracks — combined in a GIS and cross-referenced to demographic data — can provide insight to possible future damage to the electric utility infrastructure and to what extent outages may be expected. GIS spatial analysis tools make it possible to objectively calculate meaningful damage estimates, providing information for advanced logistics planning. With GIS-enabled weather information, utilities have the ability to more quickly make better decisions that can reduce losses.
The Future
Next steps with storm tracking will likely include the increasing use of mobile devices to communicate severe weather data directly to crews in the field. Today, it is possible for GIS technology to trigger and transmit locationspecific storm alerts to cell phones and e-mail enabled pagers. Advances in wireless modems, integrated into hand-held devices, also make it possible to transmit weather radar images, and eventually storm tracking information, directly to the field.
Conclusion
The evolution of weather radar technology, coupled with innovation from commercial weather service providers, has made possible continued enhancements in the ability for electric utilities to track storms. Improved knowledge of future weather conditions, both in time and space, can help enormously with managing energy loads, allowing a utility to more accurately quantify load requirements. Better decisions can help utilities avoid buying on the open market at a premium price, or having to fire up auxiliary generators. And crew numbers can be more efficiently managed without impacting the prompt, quality service that customers expect.
The new concept of weather data combined with GIS expands the electric utilities’ ability to track positions of severe storms in real time and correlate that information with outage reports to conclusively determine the cause of a particular outage. The integration of energy company assets (generation units, substations, transmission lines), customer information, and weather into a GIS creates a synergy that can greatly enhance a utility’s ability to track data simultaneously and make more accurate decisions, thereby adding value for customers and employees, as well as adding to the bottom line.
About the Author
Ron Sznaider is Vice President of Product Management for Meteorlogix, the world’s largest commercial weather services provider. Sznaider is a meteorologist with 25 years of experience in providing weather information to the energy industry. He can be contacted directly at Ron.Sznaider@meteorlogix.com.
About Meteorlogix
Meteorlogix — the world’s largest weather services provider — was established in October 2001 through the merger of three weather service leaders: business-to-business provider DTN Weather Services, broadcast and aviation weather forecaster Kavouras, and long-range forecaster and climate predictor Weather Services Corporation. Meteorlogix represents more than half a century of experience and weather information acumen, serving more than 22,000 customers with a focus on the energy, public safety, broadcast media, transportation, and aviation industries. For more information, please visit www.meteorlogix.com.