
The California Independent System Operator’s (ISO) new control center houses the first dedicated renewables dispatch facility in the nation, and what makes this facility unique is a new grid visualization technology powered by advanced geospatial software. This technology enables dispatchers to adjust in real-time to current weather conditions, while enhancing wind and solar performance forecasting. Overall, it helps the ISO maintain a reliable flow of renewable power, an economic imperative in California, and sets the stage for the state to achieve its goal of generating 33 percent of its power from renewable resources by 2020.
Tracking Renewables Adds to Information Overload
TThe ISO is a non-profit public benefit corporation that manages the bulk of California’s power grid and its wholesale electricity market. The ISO opened in 1998 as a result of the restructuring of the state’s electricity industry. The ISO is charged with operating the power grid openly and transparently. As the world’s eighth largest economy, California is an economic engine for the entire U.S., and the role of the ISO is to ensure the state always has the power it needs to keep running. The ISO manages electricity flow for 80 percent of California’s power grid, delivering 286 billion kilowatt-hours annually over 25,000 miles of power lines for about 35 million Californians.
Given this scale, ISO operators who were previously analyzing data in a traditional tabular format, often found it challenging to spot trends and anomalies, and respond quickly to changing conditions, especially given the influx of data points necessary to track an increasing number of renewable sources. In addition, because the ISO relied on independent software systems and processes across different disciplines, sharing and synchronizing information was often complex and time consuming.
This challenge has been compounded over the years because California has one of the world’s most aggressive agendas for addressing climate change, and as part of that, the state is seeing rapid development of various wind and solar facilities, along with other intermittent resources. The ISO needs to be able to keep very close track of these variable resources in order to achieve the right balance between using renewables and ensuring reliable power.
The ISO is faced with an increasingly common issue in the power industry and many other industries as well – a growing mountain of information to assimilate. How can an organization integrate and analyze more and more complex data in an efficient manner? How can it turn all that data into useful information? The California ISO sought a technology solution as it modernized its control centers and advanced visualization displays turned out to be the answer. New computer applications provide information in pictures rather than thousands of information points, making it easier to display multiple layers of data in a faster-to-consume manner.
Finding a Solution
In 2008, ISO operators faced a daunting challenge; large wildfires were burning close to transmission power lines. A rapid search for a solution uncovered Space-Time Insight, a company pioneering a visual analytics technology called situational intelligence.
Given the time-sensitive nature of the problem, an important advantage of the situational intelligence solution was that it could plug easily into the ISO systems and processes. The software integrates with data from different systems, correlates it with external data feeds and presents the results in intuitive visual displays used by the ISO’s operators and managers. It was important that the software could support the large volumes of data generated by the ISO’s infrastructure, and enable event-based correlations between points of information across space, time and node to identify problem areas, determine root causes of those problems, and facilitate rapid action on the part of operators. Most important, the solution enables the ISO’s operators to quickly visualize and analyze the data, accelerating the recognition of trends and anomalies and reducing response times.
The ISO deployed and customized the Space-Time Insight Crisis Intelligence application, combining information from CAL FIRE showing areas that have already burned, input from an infrared system highlighting areas still burning, as well as wind speed and trajectory data. This information is then overlaid on a map of the transmission system, providing operators with a clear visual representation of any lines at risk.
Because the Crisis Intelligence application enables operators to see and respond to fires in real-time, they can stay ahead of dynamically evolving situations – sometimes hours in advance of what was previously possible – and proactively work with local utilities to develop action and contingency plans. For example, they can move power flow off any lines that might be affected by a fire, protecting customers from a potential power loss and eliminating the possibility of damage caused by a fire hitting live power lines.
Based on the success of the Crisis Intelligence application, when the ISO launched its Market Redesign and Technology Upgrade (MRTU) initiative in 2009, it extended the use of situational intelligence into the wholesale electricity market.
The goal was to improve the efficiency of the market and track prices at 4,500 locations in California. The application enables the ISO to visualize real-time and day-ahead prices every five and 15 minutes through a price contour map that indicates where prices are high and where they are low. Patterns can be tracked and captured to send signals for where investments in new resources could best benefit growing power needs in a particular geographical area.
Tracking Renewables the Intelligent, Visual Way
Recognizing that meeting California’s aggressive renewables goals require more precise management of renewable resources, the ISO needed a technology solution that would help accomplish that. So, based on the success of the two prior applications, the ISO implemented Space-Time Insight’s Renewables Intelligence solution. It provides dispatchers with the ability to assess, in real-time, current conditions – such as how unexpected storms, cloud cover and wind speed might impact solar fields and wind farms – so they can make appropriate adjustments to optimize the use of renewable power.
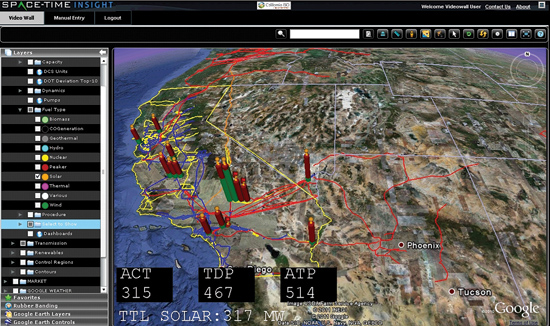
In addition, the application enables the ISO to stay within defined limits on the circuit path, which prevents damage to the power system infrastructure and helps avoid millions of dollars in potential fines. It also helps keep California on its emission-reduction trajectory. The application tracks all the different generation sources – conventional hydroelectric, solar and wind –displaying their varying real-time outputs and external impacts, such as clouds passing over a region and winds kicking up as inland regions heat up in the afternoon. For example, one display (below) combines weather feeds and cloud cover data with infrared solar imagery to show the impact of clouds and weather patterns on solar generators.
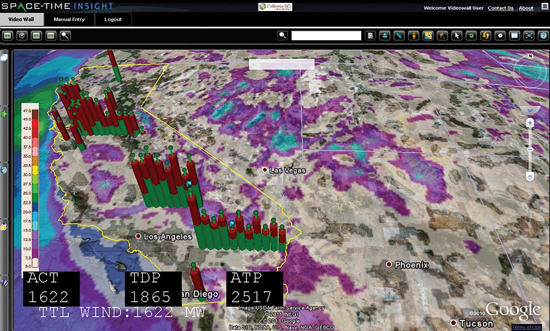
Another display shows wind speed contours, allowing operators to see pockets of fast-moving air approaching the wind generation fleets. This is very helpful in California where forecasting can be difficult because of the different geographies and climates. In the hot Tehachapi Mountains in Southern California, for instance, there are four micro-climates within one little pocket, making forecasting very complicated. The Solano and Altamont regions in the Bay Area are a little more predictable, but the cooler temperatures also mean an influx of a variety of airflows that need to be tracked.
Bringing It All Together
Recently, the ISO incorporated the applications into a new 80 ft. x 6.5 ft. video wall that fronts a state-of-the-art control center. The video displays focus on the speed at which power plants can be brought online, voltage stability, renewables forecasting, congestion management and grid reliability. Plus, the displays contain multiple layers of information at a glance and quickly alert operators and managers to potential problems. While individual users have access to relevant screens at their desktops, the 10 visualization screens on the video wall create a tremendous leap forward in enabling a big-picture view of the entire system, ensuring optimal information sharing, as well as trend and anomaly detection.
For example, a renewables portfolio displayed on the video wall shows a rolling 24-hour view of the energy produced by the basic renewables groups. Color-coding shows the usage of different energy sources. A dip in solar output is clearly visible during the night period, and the wind output reflects the variances in wind speed. One part of the display shows what small hydro facilities (capable of 30 megawatts production or less) are producing. Biomass, biogas and geothermal sources are also illustrated, each of which contribute to the renewables equation. By studying the 24-hour look-back and comparing the weather pattern for that period with the forecast for the next 24 hours, ISO generation dispatchers can make more accurate predictions about changing patterns and adjust their set points out to the generators.
The success of the new visualization capabilities is measured in how effective the ISO operators are, how reliable the system is and how effectively renewables are being integrated into the system. Today, the ISO operators are more productive and effective despite a far more complex environment. And the ability of the ISO to avoid blackouts and disruptions in supply means that the applications are enabling the ISO to successfully increase the renewables level on the grid while maintaining reliability, which is the ultimate goal.

Conclusion
With its aggressive renewable standards, California is really a rehearsal for renewables management across America. And because of this, the ISO has to deploy innovative solutions that allow it to respond in real-time to factors such as wind changes and cloud pattern developments that directly impact renewable energy generation. Only by presenting operators with information in a way that they can quickly digest it and respond to, can the ISO maintain reliability at the lowest possible cost.
The beauty of the ISO’s new geospatial renewables system is that it makes complex data easy to understand. It’s right there on a visual display for operators to see. And the system not only lets the ISO build all the various data sources into macro-view indicators, but also enables operators to dig into the details and perform analytics on the data itself. By combining external data sources with internal data, by polling the grid in millisecond intervals, and by presenting the results in a very intuitive visual display, the ISO gets a far clearer and more actionable picture of what is going on.
The transition from traditional line diagrams to the rich geospatial displays is similar to the difference between x-rays and MRIs. Now, the ISO is getting far more information, and getting it in a way that makes that information more usable. It’s one of the few applications in the ISO control center capable of doing that, helping overcome the “information-overload” syndrome from which so many other organizations are suffering. It’s completely changing in scale and timeframe what the ISO can achieve and is helping the organization deliver on its mission to help green California.
About the Authors

James McIntosh is Director and Executive Operations Advisor of California ISO where he is responsible for solving the operational challenges of renewable resource integration. He is also involved with creating renewable interconnection standards to meet grid reliability requirements. Mr. McIntosh oversaw the design of the critical asset wing of the new ISO control center and brought on line the first renewables dispatch desk in the United States. In helping to create the most modern control center in the world, Mr. McIntosh also facilitated a unique partnership with Google to develop situational awareness screens to equip operators with high-tech visualization tools that are integral to maintaining reliability as California achieves its 20 percent and 33 percent renewable goals.

As Founder and CTO of Space-Time Insight, Krishna Kumar leads vision and strategy for the Space-Time Insight suite of products. He pioneered the innovation behind Space-Time Insight’s Space-Time Awareness Server (STAS) that analyzes, correlates, and geospatially visualizes data from multiple data sources and enables initiation of preventive action from a geospatial screen. He is regarded by leading energy companies as a thought leader in real-time, situational intelligence and high-context visualization of geospatial analytics. Recognized for his vision and innovative spirit, Krishna is a popular speaker at tradeshows and conferences worldwide.