
For many utilities, distribution system vegetation management (VM) programs represent both a substantial portion of annual maintenance spending as well as a major point of contention with customers over the aesthetic impacts resulting from VM. But when VM programs are implemented and managed properly, the result is almost always improved reliability -- even for customers who argue about the aesthetics. Yet even utilities with large-scale VM programs in place still experience vegetation-related outages that can account for as much as 20- 50% of service outages, measured in customer minutes interrupted. To further mitigate these outages, proper VM program design is imperative.
What does this large annual expense buy in terms of improved reliability and how should a program be designed? The answer often is “it’s hard to say.” And in reality it is, and here is why:
- Reliability metrics (which would help us measure the effect part of cause and effect) and their composition are often an afterthought to the restoration process.
- During the restoration it may not be clear that the cause was vegetation related as the evidence may be gone.
- Vegetation growth is subject to all manors of variable environmental factors and certainly not necessarily consistent throughout a distribution system.
- Distribution circuits vary greatly in layout, equipment and customers so it follows that the benefits of a program will vary by circuit.
Despite these difficulties, in the modern data-centric utility world surely something can be done to do better. So, what’s in our data tool-kit that we can put to work?
- Outage Management Systems – Can provide estimates for interruptions caused by vegetation often on a circuit basis; we’ll need to make some assumptions about how accurate this information is.
- Rainfall Measurements – We’ve found through work with several utilities that a lagging estimate shows a very high correlation to growth (this may seem obvious, but to quantify it is another thing).
- Historical Trim – We’ll need to know what’s been done in the past and how much it cost us.
- Circuit Exposure – Not surprisingly, the amount of exposure to vegetation (of equipment that is susceptible to failure) has a direct relationship to the amount of vegetation-related outages. Some utilities are even starting to collect vegetation data-mappings that can be used to overlay with Geographic Information Systems (GIS) mapping delivery equipment to create an instant exposure map.
- Circuit Models – Using information that is already put to use by load-flow programs, can be used to estimate reliability.
- Weather Data – Can be used to get detailed statistics about how vegetation-related outages vary under different conditions.
Several utilities are already putting this available information to use in innovative ways, not only estimate the future impact of their current program on reliability, but also to consider, drive and justify program changes.
Cycle Trimming: An Example
As an example of this, let’s take a look at a common ‘go-to’ installment of many VM programs: Cycle Trimming. Cycle trimming can come in several varieties, but the most basic is a flat cycle, where every ‘X’ years a circuit is trimmed. Some variations of this are reliability-based trimming (i.e., poor reliability feeders are trimmed more frequently) or some further granularity, such as only trimming laterals every 8 years, while primaries are trimmed every 4 years.
Using historical reliability metrics attributed to vegetation on a feeder basis, circuit exposure, and historical trim dates for those same feeders, we can correlate the years-since-trim and outage events – the time elapsed since a circuit was last trimmed.
FIGURE 1 shows an example of how the relationship between years-since-trim and outage events may look. (A single outage event may lead to many customer interruptions depending on where the outage event occurs on the system.) It’s important to note that this figure implies that no matter how frequent the trim cycle is – even in ‘Year 0’ – vegetation-related outage events still occur; so what gives?
Well, the cycle trimming adheres to a standard – this standard, which defines the minimum acceptable distance between lines and vegetation - will vary by utility. The types of interruptions we are experiencing are outside of this range and still making contact or, perhaps are the result of some violation of the standard. Given the current standard, in this example it appears that the lowest we can expect outage interruptions to go (even if we trimmed all the time) would be about 0.16 outage events per year mile. In other words, if we had a 10-mile long distribution line and a year elapses on average between trims, we would expect to see 1.6 outage events.
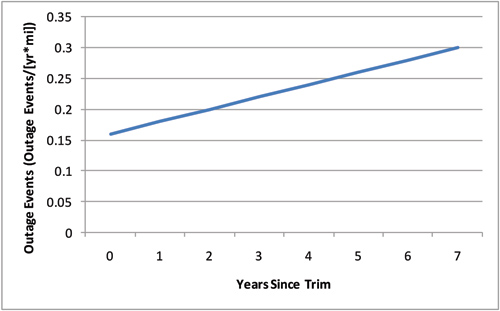
Figure 1: Vegetation-Related Outages by Years-Since-Trim
Further, this relationship between outage events can be employed to estimate the direct reliability impact on a given circuit using a model or even system-wide by aggregating or extrapolating. Using this outage event model and a reliability modeling approach, alternatives to the current trim cycle can be investigated with a reasonable level of confidence in the impact of those changes. This can be taken even further by comparing the marginal costs and benefits or even by comparing those results with alternative reliability solutions to find the best overall value.
Solutions
How else can we put this information to work for us?
- Determine the benefit of switching from a ‘one-size-fits-all’ solution to a cycle schedule that targets the best bang-for-the-buck circuits. It’s likely that better reliability can be achieved for the same cost or, the same reliability for a lower cost.
- Determine how rainfall impacts growth rates and reliability and what can be expected in the upcoming years.
- Determine the impact of historical changes in a vegetation management program. Often, a utility will want to know what a major program change has meant in terms of benefits; that is, did it really live up to expectations?
Plus, with the increasing amount of information at the disposal of utilities across their entire organizations, pulling the pieces together in creative ways can answer some otherwise tough questions… and having those answers can be a real advantage.
About the Author

Clay Tutaj is a Senior Consultant with KEMA Inc. in Raleigh, NC. Mr. Tutaj provides analytical solutions for reliability, asset management, emergency response and storm forensics for transmission and distribution systems internationally. He can be reached at clay.tutaj@ kema.com.