
To maximize the benefits from smart grid programs like demand response and net metering, utilities will need to know a lot more about their customers than they do today. That means not just collecting their data but also analyzing it. How much do you really know about YOUR customers?
If your utility is like most, the answer is: not much. You know which customers are residential. You know their location, their energy consumption history, and their bill/payment records. You may know that they have used an efficiency rebate or automatic debit.
You know a lot more, of course, about your large commercial and industrial customers. Key account managers may work with many of these customers on a daily basis, helping them manage their energy consumption. When those customers agree to participate in load reduction programs, grid operators analyze their usage to ensure that, in emergencies, they can decrease load in the exact spots needed to prevent brownouts and blackouts.
Until now, that has been enough. But compared to companies that must pro-actively attract and retain customers, utility customer information seems a drop in the bucket. Manufacturers, wholesalers, and retailers constantly search for more details about their customers so that they can offer products designed to please them at the optimal price point.
Historically, utilities and regulators have rejected data-gathering techniques such as tracking individual consumer movements from one Web page to the next or purchasing demographic information by zip code. Customers’ incomes, ages, or home values are unrelated to utility service provision. Why gather or analyze data you do not need?
A New Era
All of that is about to change. The premise behind the smart grid is that information, analyzed and used appropriately, can reduce power waste and thus lower the amount of generation needed to supply a utility’s territory. Less generation means not merely an economic cost savings but also a reduction in the toll that generation exacts on the environment. Those are social benefits worth pursuing.
Much of the smart grid’s efficiency enhancement will occur at the grid level, where sensors and meters will measure power flow in small increments, and where software will use that data to optimize grid performance. There is, however, a more significant benefit for utilities to gain by more carefully analyzing customer data.
Eliminating the “Spare Refrigerator” Problem
Let’s take a simple example: measuring the effectiveness of rebates that encourage consumers to purchase highly efficient refrigerators.
In the past, utilities commonly evaluated rebate programs by totaling the number of rebates given to their customers. Some utilities went a step further and asked participating merchants to compare the number and efficiency ratings of refrigerators sold prior to the rebate program with those sold during the rebate period.
Neither of these measurements, unfortunately, addressed the actual program goal: to reduce the amount of electricity households use to refrigerate their groceries.
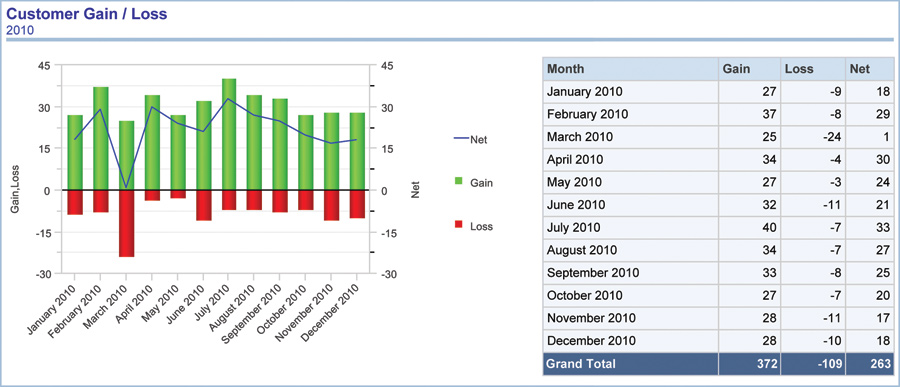
For retailers and for conservation program managers, following the numbers of customers gained and lost each month can give significant insights into the effectiveness of various marketing campaigns.
Of course, the consumer’s trip to the appliance store might have resulted in the purchase of not only a new refrigerator but also a new big-screen TV. Here is where utilities need to move to a second level of analysis using intervals of an hour or 15 minutes rather than a day. The consumption pattern of a refrigerator, with its regular on/off cycles, is markedly different from that of a television – at least, in the vast majority of households. Graphing typical refrigerator consumption against the actual interval consumption as reported by the customer’s meter should readily show if the customer has replaced the old refrigerator with the new one or has simply moved the old one to the basement and is now cooling more food.
Might utilities address the “spare refrigerator” issue in a different way? Of course; but running an analysis on customer consumption is far easier, more energy efficient, and likely far more cost effective than collecting, transporting, and disposing of all those used refrigerators.
Marketing Efficiency
The need for customer analytics becomes even more acute when utilities try to increase participation in demand response or other energy conservation programs.
Without detailed customer information and the ability to analyze it, most utilities have no choice but to offer “one-size-fits-all” programs. Every customer gets the same offer via the same bill-stuffer. What happens if a program is undersubscribed? Utilities are likely more than willing to change it. But without the ability to compare the customers who accepted with those who did not, they scarcely know where to begin.
Feeding demographic data into the customer database can change this picture. Data on house size, age of inhabitants, and features like central air conditioning may be available from the assessor’s office. Highly sophisticated demographic data is generally available by zip code from companies in the business of assembling and providing it. Increasingly, utilities are seeking information from customers themselves about their household’s use of technologies and motivations for participating in various utility programs. All this provides the means to distinguish the characteristics of program participants from non-participants and to experiment with alternatives that can increase the success rate.
Spatial Analytics: The Next Frontier
While charts and graphs are helpful, they pale in comparison to spatial analytics, especially for staff members who are not full-time analysts.
Spatial analytics applications take digital data and turn it into maps; that’s nothing new. Utilities were among the first adopters of Geographic Information Systems (GIS) and have long used them to pinpoint outages, manage assets, and map construction and repair projects. What IS new is the pre-packaged spatial mash-up…
Analyzing consumption data from smart meters, however, can clarify program success. The first step might be to compare a weekly total before and after the rebate. There is such a dramatic difference in the electricity use of a new, efficient refrigerator vs. a 10-year-old standard refrigerator. That failure to see a significant consumption drop is the first clue that the rebate may not have accomplished its goal.
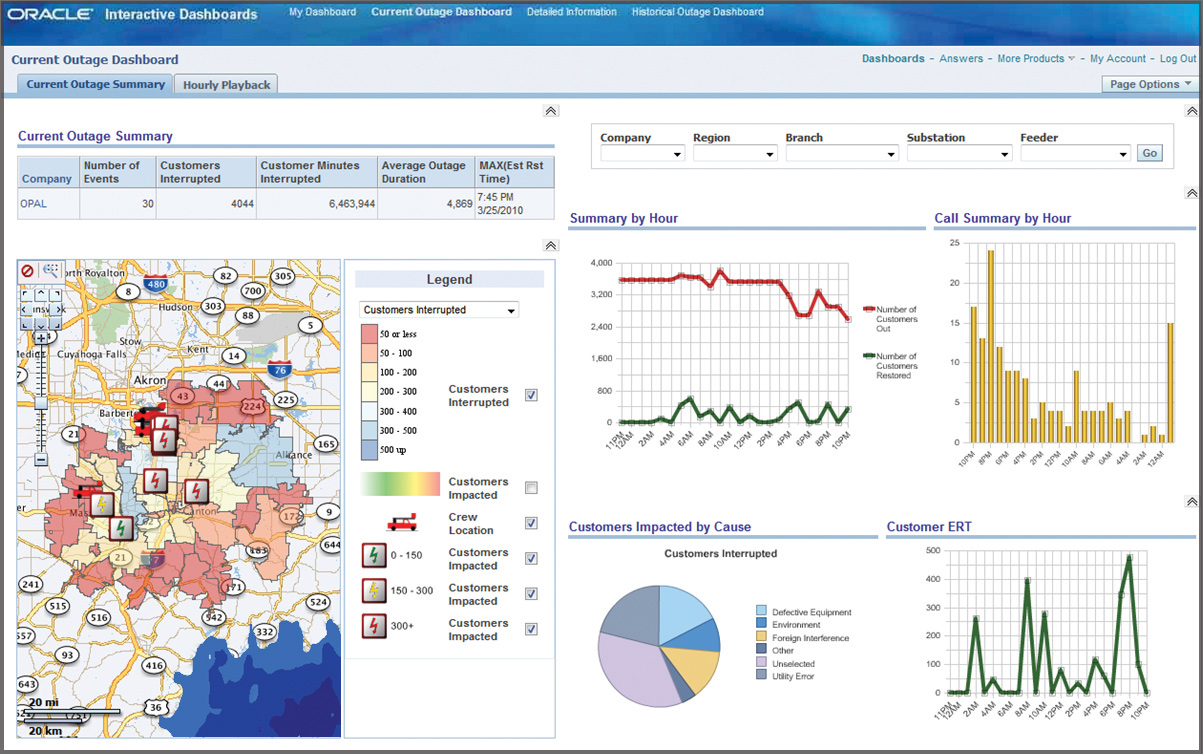
Utilities can gain new perspectives on customers when they take a set of data and display it using several different analytic tools, like maps, pie charts, and graphs.
Spatial mash-ups typically combine data from two or more sources and display the result as a map. Utilities might, for instance, map the addresses of unhappy customers with a map of frequent outage locations to see if there is a correlation.
Simple mash-ups like this may be moderately useful. But they become far more valuable when users can query the data – a sort of spatial regression analysis. Starting with the complaint/outage map above, utilities can sort customers who complained about outages from those who complained about high bills. They can compare those who complained about high bills with those who signed up for a new Demand Response (DR) program. Utilities can also compare those who signed up for DR with those who started service in the past 12 months or those with at least two late payments or those whose consumptions patterns indicate very low usage during the workday.
Typically, utilities just beginning the use of spatial mash-ups will find “correlations” that make little sense, at least initially. They might discover, for instance, that customers with the longest outage durations also sign up for more refrigerator rebates and have the best bill-paying records. Check that data against similar data from different years, different service territories, or other utilities in your trade association. You may discover that the outage/bill-paying association is a fluke but that many utilities show a correlation between outages and new refrigerators. Might that be because consumers have discovered that, in the event of an outage, food stays colder for a longer period of time in a new, more efficient refrigerator? And if that is the case, shouldn’t you be using that to entice more consumers to join your refrigerator rebate program?
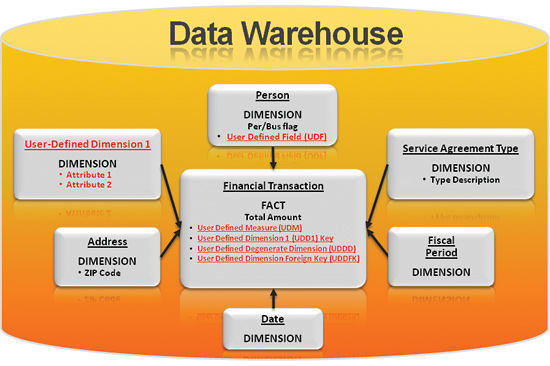
Pre-packaged analytics applications are not necessarily restrictive. Some permit utility-defined fields and even utility-defined dimensions.
Getting There From Here
If your utility is using the same legacy customer information system (CIS) it cobbled together in 1985, if your chief financial officer (CFO) turns green when she contemplates those enterprise-wide business intelligence (BI) projects of the past – the ones that required three bus-loads of newly-minted Masters of Business Administration to implement – talk of major new analytic initiatives may seem like little more than talk.
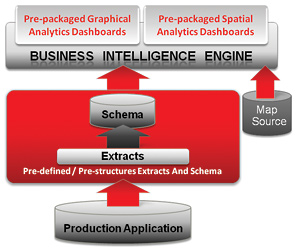
Take heart. Software vendors understand that to be effective, analytics must be less costly and easier to use. They are coming out with BI applications that sit on top of production applications and are designed to work right out of the box. They prepackage the extracts and schema that go into the data warehouse and place them within a star-schema-based data warehouse. They provide standard sets of analytic tasks pre-programmed into dashboards. Then they make multiple BI applications available from the same dashboard so that you can ask questions that involve more than one source of data.
These vendor-provided, pre-packaged BI products are an easy way to get started down the analytics path. Moreover, you do not have to undertake an entire enterprise-wide BI project all at once. And, you need not hire expensive consultants or new analytics staff. The dashboards are intuitive enough for staff and managers to use right out of the box. These new, structured BI tools can answer many current questions quickly and easily. Longer term, however, vendors will have to provide more.
Pre-packaged, application-specific analytics applications that are provided by the vendor of the underlying production application can provide utility staff with fast and easy ways to understand customer dynamics.
The “Unknown Unknowns”
The smart grid has launched utilities toward the unknown.
We know that in the very near future, we will have enormous amounts of data to work with. The smart meters now taking over the utility landscape will provide staggering amounts of data about each customer. Six channels of data recorded every hour or every fifteen minutes – or perhaps even every five minutes. By the time we are adding data from home devices to our data store, a Tier-1 (typically a large investor-owned) utility will be organizing, storing, and using more than 800 terabytes of data, according to a recent estimate. And that’s before you add in data related to electric vehicle recharging.
The history of technology assures us that the availability of large amounts of new data will help us improve our business processes, find new efficiencies, and provide new services. But traditional BI tools, with their highly structured star schemas, may not be adequate for this task. To mine these immense data volumes for new options, new proactive business processes, and new ways to predict business outcomes, utilities may require less structured query tools. Those tools will have to function without disrupting ongoing operations. They will have to return answers in near real time.
So what might that look like? Tomorrow’s answers may well emerge from a huge data dump manipulated rapidly and easily from a reporting engine that fosters unstructured drill downs.
At this point, no one knows precisely what such data manipulations will tell us. Former U.S. Secretary of Defense Donald Rumsfeld might well have been speaking about the smart grid when he opined, “There are known unknowns; that is to say we know there are some things we do not know. But there are also unknown unknowns – the ones we don’t know we don’t know.”1
Starting with today’s application- and suite-specific BI tools is an excellent first step. Operational and business staff must become self-sufficient in basic data analysis so that they can emerge with the insights to serve customers better in the near term. Longer term, however, we will reap the greatest efficiencies and the greatest benefits by fully exploring smart grid data’s unknown unknowns.
About the Author

Guerry Waters is Vice President of Industry Strategy, Oracle Utilities. He joined Oracle Utilities in 2006 when Oracle acquired SPL WorldGroup, a company he joined in 2000. Previous positions include Vice President of Energy Information Strategy at META Group (now Gartner) and CTO and Director of Technology Strategy and Engineering at Southern Company. He focuses on IT strategies that help utilities meet their goals amidst changing customer demands, regulations, and market structures.
1 At a Washington, DC, press briefing, February 12, 2002.