
Loading capability of power transformers is limited mainly by winding temperature. As part of acceptance tests on new units, the temperature rise test is intended to demonstrate that, at full load and rated ambient temperature, the average winding temperature will not exceed the limits set by industry standards. However the temperature of the winding is not uniform and the real limiting factor is actually the hottest section of the winding commonly called winding hot spot. This hot spot area is located somewhere toward the top of the transformer, and not accessible for direct measurement with conventional methods.
The temperature of solid insulation is the main factor of transformer aging. With temperature and time, the cellulose insulation undergoes a depolymerization process. As the cellulose chain gets shorter, the mechanical properties of paper such as tensile strength and elasticity degrade. Eventually the paper becomes brittle and is not capable of withstanding short circuit forces and even normal vibrations that are part of transformer life. This situation characterizes the end of life of the solid insulation. Since it is not reversible, it also defines the transformer end of life.
This process is well known to transformer owners and sustained efforts have been made to monitor the hot spot temperature to take advantage of cool ambient temperature, extend the transformer life while providing emergency overloading capabilities and taking advantage of market opportunities. Figure 1 shows the sensitivity of paper to temperature. Modern transformers make use of thermally upgraded paper that has been chemically treated to improve the stability of cellulose structure. The rated hot spot temperature for this kind of paper is 110°C and it can be seen that an increase of 7°C will double the aging acceleration factor. For older transformer built with normal Kraft paper, the rated hot spot temperature is either 95°C according to IEEE or 97°C according to IEC. This paper is also very sensitive to temperature and in case of emergency (assuming a hot spot temperature of 140°C) the aging acceleration factor is about 100, which means one hour in this condition is equivalent to 100 hours at the rated temperature.
Wet transformers (solid insulation showing more than 2% water content) incur an additional risk when operating at high temperature. It has been shown that the residual water trapped in paper may reach bubbling conditions and escape from paper under the form of water vapor bubbles. These bubbles may move with the oil flow, or get trapped in the winding and in both cases create a threat for insulation breakdown. No wonder that the transformer operator attempts to control the winding hot spot temperature with the best mean available.
Recent development on winding temperature calculation methods For several decades IEEE and IEC loading guides (1,2) have been providing guidelines for the calculation of the winding hottest spot temperature from data that can be conveniently measured and parameters derived from temperature rise test or manufacturer calculations. The basic calculation method relies on the measurement of oil temperature at the top of the transformer tank (top-oil temperature) and a calcultion of the temperature difference between the winding hottest spot and the top oil. This temperature rise is provided by the manufacturer, based on his modeling of oil flow and losses distribution in the winding. Thereafter the hot-spot temperature can be computed for any load using the standard relation:
Where:
 - Hot-spot temperature
- Top-oil temperature
- Rated hot-spot temperature rise above top oil
- Load current
- Rated current
- Winding exponent
This simple formula was completed with an exponential function to account for the thermal inertia of the winding when a sudden loadincrement is applied. This calculation method has been around forseveral decades but a more frequent utilisation of transformer overload capability has shown the inadequacy of this method.
IEEE approach
A revision of the loading guide for power transformers is currently in progress. It is noted that the traditional hot-spot temperature calculation method uses a number of assumptions that are not correct:
• Oil temperature in the cooling duct is assumed to be the same as the top oil temperature
• The change in winding resistance with temperature is neglected
• The change in oil viscosity with temperature is neglected
• The effect of tap position is neglected
• The variation of ambient temperature is assumed to have an immediate effect on oil temperature.
Moreover, experimental work has shown that at the onset of a sudden overload, oil inertia induces a rapid rise of oil temperature in the winding cooling ducts that is not reflected by the top oil temperature in the tank. Therefore alternate sets of equations are being developed, taking into account all these factors.
An additional important evolution is the disappearance of the guide on definition of transformer “Thermal Duplicate” that was often used to provide default values for winding temperature rise at rated load (3). This reference will not be available anymore to provide support to the hot-spot temperature rise estimated by the manufacturer. This might reduce the credibility of transformer manufacturer in providing that critical thermal parameter.
IEC approach
A new edition on the loading guide has recently been published (2). It is now more clearly stated that the “H” factor relating the average winding to oil gradient to the hot-spot to top oil gradient can vary over a wide range depending on transformer size impedance and design. Here again the correct calculation of the critical temperature difference between winding hottest spot and top oil will depend on manufacturer ability to model properly the oil flow within the winding ducts, the distribution of losses along the winding, the heat transfer characteristics of the various insulation thickness used throughout the winding and the impact of local features restricting the oil flow.
It is also recognized that the dynamic response of the previous calculation method is not adequate as a sudden increase in load current may cause an unexpected high peak in the winding hot-spot temperature. To cover all type of load variations, an elaborate set of differential equations is provided, taking account the winding thermal time constant, the oil time constant and three new constants to characterize the oil flow.
All these changes in IEEE and IEC loading guides indicate that hot-spot temperature calculation methods previous known were not adequate to assess accurately winding hot-spot temperature. Wide use of computers now allows for sophisticated calculation methods but it demonstrates that the quest of winding hot-spot temperature is not trivial and it raises new doubts considering the number of additional values that need to be collected to run the calculation. No wonder that the direct measurement of winding temperature with fiber optic sensors is the recommended practice for critical transformers (2,4,5).
Recent development on direct measurement of winding hot-spot temperature
For nearly thirty years, fiber optic temperature sensors have been available for measurement in high voltage transformer. First units were fragile and needed delicate handling during manufacturing. Over the past ten years, significant development took place to improve ruggedness and facilitate connection through tank wall.
The fiber optic probe on the Neoptix™ T/Guard system consists of a 200-micron solid-state optical fiber sheathed with a permeable protective PTFE Teflon sheath. This probe is designed to withstand manufacturing conditions including kerosene desorption as well as long term immersion in transformer oil. Permeability of the Teflon jacket allows for full impregnation under vacuum. The temperature-sensing element is based on the proven GaAs technology and is driven with an original algorithm to analyze the signal and provide repeatable and reproducible measurements.
In order to measure winding temperature, the sensor can be embedded in a spacer or attached directly onto any conductor that deserves temperature monitoring. Figure 3 shows an example of sensor directly in contact with a continuously transposed cable (CTC). The insulation must be removed locally and restored after sensor installation.
The more popular method is to insert the sensor in the spacer between successive disks. A slot is cut in the radial spacer and thesensor is glued in place as indicated in Figure 4. This method avoids the delicate task of breaking and restoring the conductor insulation. Since the spacer is actually preventing oil circulation at this location, the temperature gradient in the spacer is very small and the sensor reaches a temperature that is the average of the two disks. This is illustrated in Figure 5 where we compare temperatures from two sensors in contact with the winding and one sensor inserted in the spacer below the same winding. It can be seen that the temperature measured in the spacer is actually slightly higher than the measured conductor temperature.
The installation of the fiber optic probe and the handling of this long fiber during manufacturing are certainly challenging to avoid sharp bends that could break the optical fiber. Among improvements that were introduced is the temporary spooling of the fiber as shown on Figure 6. Another improvement is the simplified through-wall connection shown in figure 7. This optical feedthrough has a simple design that provides both low-loss optical connection and leak-free operation. With these improvements the survival rate of fiber optic sensors is now better than 90%.
Field Experience with fiber optic temperature sensors
Since 1998, Manitoba Hydro has installed fiber optic temperature sensors in more than a dozen critical transformers, each of these transformer containing 8 probes. In one case the unit was equipped with 48 fiber optic sensors in the scope of a large investigation to provide the full picture of temperature distribution inside the transformer. The characteristics of this unit are summarized as follows:
The transformer is a directed-flow type, with oil forced directly in the windings. All pumps are continuously in service while the fans are set in two stages. One set is hand-operated and was continuously operated during the period reported here. The other set is in automatic mode and is turned on when the winding temperature reaches 50 °C. The transformer is shown in Figure 8. As part of its normal duty, this transformer undergoes significant load variations, as can be seen on Figure 9. The load demand fluctuations and the periodic connection of a large synchronous condenser result in a daytime load of typically 1 p.u. and nighttime load of 0.4 p.u. These wide load variations allow for a better evaluation of the dynamic behavior of the winding hot-spot temperature model proposed in the standards.
For this winding, the rated hot-spot rise above top-oil was estimated by the manufacturer to be 25 °C. For the winding exponent, the IEEE and IEC guides recommend for directed flow the use of m=1. It can be seen that with these values the winding hot-spot temperature calculated from manufacturer prediction and classical model can be off by about 7 degree at rated load. This would lead to about 14 degree at 150% overloading. Fiber optic temperature sensor provides a much more dependable temperature value. Even then, it might be useful to have a valid model for prediction purpose. This can be achieved by adjusting the rated hot-spot rise, the winding exponent and the winding thermal time constant. It is then possible to take full advantage of the
loading capability, maintain service during contingency or to carry additional load to take advantage of market opportunity.
Reinforcement of Overloading Capability
Most power transformers have inherently some margin of overloading capability. The rated capacity of a unit is basically the load level that will result in internal temperatures not exceeding the limits set forth by industry standard such as the IEEE and IEC. The application of loads in excess of the nameplate rating involves a degree of risk and accelerated aging. These effects are discussed at length in the IEEE and IEC loading guides (1-2) and can be summarized as follows:
• For long-duration overloads, the main consequence is the thermal aging of the solid insulation.
• For short-term transformer failures, the main risk is the reduction of dielectric strength due to the release of gas bubbles in regions of high electrical stress. The probability of occurrence of these bubbles is closely related to the winding hot-spot temperature and the moisture content of the insulating paper.
• Under overloading conditions, some components such as LTC contacts and bushing connections may develop high temperatures leading to thermal runaway.
It is generally recognized that the risks associated with overloading can be significantly reduced if the transformer conditions are closely monitored throughout the overload period (6-7). Monitoring of winding hot-spot temperature and dissolved gas-in-oil and furan-in-oil provides a major support to the operator when the transformer faces overload conditions. On-line monitoring of winding temperature can provide a dynamic evaluation of insulation degradation and the relative loss of life can then be converted into cost. The cost attributed to loss of life needs to be subtracted from the apparent benefits achieved from transmitting this extra load. The loss of life cost can also be useful when calculating the cost of transmitting this additional amount of energy.
To quantify the benefit of continuous winding temperature monitoring, the additional loading margin provided by monitoring needs to be estimated. Field experience with transformer overloading is still limited, but as a first approximation, it can be conservatively assumed that if the parameters mentioned above are properly monitored, the transformer can carry an extra 10% loading with the same degree of confidence that would exist in operation without monitoring. Thus, the value of a monitoring system can be compared directly with the value of additional transformer capacity made available by the monitoring system. However this rough approach neglects the additional loss of life that would be incurred when operating at high temperature.
A better approach would be to calculate the economic benefit that would ensue from using the additional loading capability to take advantage of market opportunities. As a numerical example, assume that a 100MVA transformer could be requested to carry a 10% overload, for about 5% of the time, when the market condition are attractive. Assuming an ambient temperature of 30°C, the calculation of benefit, including allocation for loss of life would unfold as follows:
This rough calculation assumes steady temperature conditions during overload but it allows us to show the magnitude of benefit that can be expected from using the transformer full loading capability under adequate control. Conclusions Loading capability of power transformers is limited mainly by winding temperature. It has been the practice to assess this temperature from a measurement of oil temperature at the top of the tank with an added value calculated from load current and winding characteristics. With more frequent occurrence of overloading, it has been found that this simplified approach is not suitable for several types of overload and transformer design.
In an attempt to close this gap, IEEE and IEC loading guides are being revised with more sophisticated models aiming at a better representation of oil temperature inside the winding, considering variations in winding resistance, oil viscosity and oil inertia. Still, direct measurement of winding temperature with fiber optic sensor provides a definitive advantage over a value calculated from uncertain parameters provided by the manufacturer and uncertain equations characterizing the cooling pattern.
In response to this important need, fiber optic sensors have significantly improved to the point that direct measurement of winding temperature is now becoming the preferred method to measure this critical parameter. Compatibility of fragile fiber optic sensor with transformer factory environment has been a problem in the past but is now resolved with sturdy fiber jackets, proper spooling of sensor during factory work, and simplified through-wall connection.
Fiber optic sensors have reached maturity for application in power transformers and should become a standard feature for new transformers. Immediate knowledge of winding hot-spot temperature provides the necessary confidence to carry through overload occurrences and reaps full benefit from this asset.
References
1. IEEE C57.91 1995 “IEEE Guide for Loading Mineral-Oil-Immersed Transformers”
2. IEC 60076-7 “Power Transformer -Part 7: Loading Guide for Oil-Immersed Power Transformers”
3. IEEE C57.145 “Guide for the Definition of Thermal Duplicate Liquid-Immersed Distribution, Power and Regulating Transformer”
4. IEEE 1538-2000 “ IEEE Guide for Determination of maximum Winding Temperature Rise in Liquid-Filled Transformers”
5. CIGRE Working Group 09 of Study Committee 12 “Direct Measurement of the Hot-Spot Temperature of Transformers” Cigre ELECTRA, No 129, pp47-51, March 1990
6. W.J. Bergman, “Equipment Monitoring Selection as Part of Substation Automation” Panel Session, IEEE Winter Power Meeting, New York, 1999
7. T. Molinski, “Minimizing the Life Cycle Cost of Power Transformers”, CIGRE Colloquium, June 2001, Dublin, Ireland
The temperature of solid insulation is the main factor of transformer aging. With temperature and time, the cellulose insulation undergoes a depolymerization process. As the cellulose chain gets shorter, the mechanical properties of paper such as tensile strength and elasticity degrade. Eventually the paper becomes brittle and is not capable of withstanding short circuit forces and even normal vibrations that are part of transformer life. This situation characterizes the end of life of the solid insulation. Since it is not reversible, it also defines the transformer end of life.
This process is well known to transformer owners and sustained efforts have been made to monitor the hot spot temperature to take advantage of cool ambient temperature, extend the transformer life while providing emergency overloading capabilities and taking advantage of market opportunities. Figure 1 shows the sensitivity of paper to temperature. Modern transformers make use of thermally upgraded paper that has been chemically treated to improve the stability of cellulose structure. The rated hot spot temperature for this kind of paper is 110°C and it can be seen that an increase of 7°C will double the aging acceleration factor. For older transformer built with normal Kraft paper, the rated hot spot temperature is either 95°C according to IEEE or 97°C according to IEC. This paper is also very sensitive to temperature and in case of emergency (assuming a hot spot temperature of 140°C) the aging acceleration factor is about 100, which means one hour in this condition is equivalent to 100 hours at the rated temperature.
Wet transformers (solid insulation showing more than 2% water content) incur an additional risk when operating at high temperature. It has been shown that the residual water trapped in paper may reach bubbling conditions and escape from paper under the form of water vapor bubbles. These bubbles may move with the oil flow, or get trapped in the winding and in both cases create a threat for insulation breakdown. No wonder that the transformer operator attempts to control the winding hot spot temperature with the best mean available.
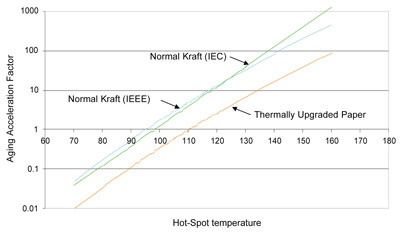
Fig. 1 Effect of temperature on paper aging rate
Recent development on winding temperature calculation methods For several decades IEEE and IEC loading guides (1,2) have been providing guidelines for the calculation of the winding hottest spot temperature from data that can be conveniently measured and parameters derived from temperature rise test or manufacturer calculations. The basic calculation method relies on the measurement of oil temperature at the top of the transformer tank (top-oil temperature) and a calcultion of the temperature difference between the winding hottest spot and the top oil. This temperature rise is provided by the manufacturer, based on his modeling of oil flow and losses distribution in the winding. Thereafter the hot-spot temperature can be computed for any load using the standard relation:
Where:
- Hot-spot temperature- Top-oil temperature
- Rated hot-spot temperature rise above top oil
- Load current
- Rated current
- Winding exponent
This simple formula was completed with an exponential function to account for the thermal inertia of the winding when a sudden loadincrement is applied. This calculation method has been around forseveral decades but a more frequent utilisation of transformer overload capability has shown the inadequacy of this method.
IEEE approach
A revision of the loading guide for power transformers is currently in progress. It is noted that the traditional hot-spot temperature calculation method uses a number of assumptions that are not correct:
• Oil temperature in the cooling duct is assumed to be the same as the top oil temperature
• The change in winding resistance with temperature is neglected
• The change in oil viscosity with temperature is neglected
• The effect of tap position is neglected
• The variation of ambient temperature is assumed to have an immediate effect on oil temperature.
Moreover, experimental work has shown that at the onset of a sudden overload, oil inertia induces a rapid rise of oil temperature in the winding cooling ducts that is not reflected by the top oil temperature in the tank. Therefore alternate sets of equations are being developed, taking into account all these factors.
An additional important evolution is the disappearance of the guide on definition of transformer “Thermal Duplicate” that was often used to provide default values for winding temperature rise at rated load (3). This reference will not be available anymore to provide support to the hot-spot temperature rise estimated by the manufacturer. This might reduce the credibility of transformer manufacturer in providing that critical thermal parameter.
IEC approach
A new edition on the loading guide has recently been published (2). It is now more clearly stated that the “H” factor relating the average winding to oil gradient to the hot-spot to top oil gradient can vary over a wide range depending on transformer size impedance and design. Here again the correct calculation of the critical temperature difference between winding hottest spot and top oil will depend on manufacturer ability to model properly the oil flow within the winding ducts, the distribution of losses along the winding, the heat transfer characteristics of the various insulation thickness used throughout the winding and the impact of local features restricting the oil flow.
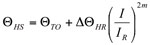
It is also recognized that the dynamic response of the previous calculation method is not adequate as a sudden increase in load current may cause an unexpected high peak in the winding hot-spot temperature. To cover all type of load variations, an elaborate set of differential equations is provided, taking account the winding thermal time constant, the oil time constant and three new constants to characterize the oil flow.
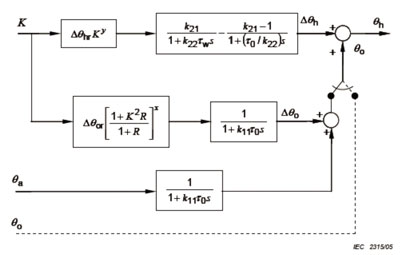
Fig. 2 Block diagram of IEC differential equation model for hot spot determination under dynamic loading conditions
All these changes in IEEE and IEC loading guides indicate that hot-spot temperature calculation methods previous known were not adequate to assess accurately winding hot-spot temperature. Wide use of computers now allows for sophisticated calculation methods but it demonstrates that the quest of winding hot-spot temperature is not trivial and it raises new doubts considering the number of additional values that need to be collected to run the calculation. No wonder that the direct measurement of winding temperature with fiber optic sensors is the recommended practice for critical transformers (2,4,5).
Recent development on direct measurement of winding hot-spot temperature
For nearly thirty years, fiber optic temperature sensors have been available for measurement in high voltage transformer. First units were fragile and needed delicate handling during manufacturing. Over the past ten years, significant development took place to improve ruggedness and facilitate connection through tank wall.
The fiber optic probe on the Neoptix™ T/Guard system consists of a 200-micron solid-state optical fiber sheathed with a permeable protective PTFE Teflon sheath. This probe is designed to withstand manufacturing conditions including kerosene desorption as well as long term immersion in transformer oil. Permeability of the Teflon jacket allows for full impregnation under vacuum. The temperature-sensing element is based on the proven GaAs technology and is driven with an original algorithm to analyze the signal and provide repeatable and reproducible measurements.
In order to measure winding temperature, the sensor can be embedded in a spacer or attached directly onto any conductor that deserves temperature monitoring. Figure 3 shows an example of sensor directly in contact with a continuously transposed cable (CTC). The insulation must be removed locally and restored after sensor installation.


Fig. 3 Fiber optic sensor directly in contact with CTC cable
The more popular method is to insert the sensor in the spacer between successive disks. A slot is cut in the radial spacer and thesensor is glued in place as indicated in Figure 4. This method avoids the delicate task of breaking and restoring the conductor insulation. Since the spacer is actually preventing oil circulation at this location, the temperature gradient in the spacer is very small and the sensor reaches a temperature that is the average of the two disks. This is illustrated in Figure 5 where we compare temperatures from two sensors in contact with the winding and one sensor inserted in the spacer below the same winding. It can be seen that the temperature measured in the spacer is actually slightly higher than the measured conductor temperature.
Probe installation – Technique 1
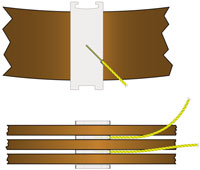
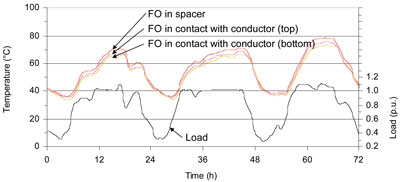
Fig.5 Discrepancy between temperature measurement for sensor on the conductor and sensor in the spacer
The installation of the fiber optic probe and the handling of this long fiber during manufacturing are certainly challenging to avoid sharp bends that could break the optical fiber. Among improvements that were introduced is the temporary spooling of the fiber as shown on Figure 6. Another improvement is the simplified through-wall connection shown in figure 7. This optical feedthrough has a simple design that provides both low-loss optical connection and leak-free operation. With these improvements the survival rate of fiber optic sensors is now better than 90%.
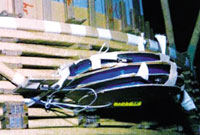
Fig. 6 Temporary spooling of fiber optic sensor
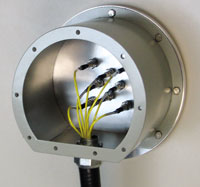
Fig. 7 Feedthrough fiber optic plate, with protection box
Field Experience with fiber optic temperature sensors
Since 1998, Manitoba Hydro has installed fiber optic temperature sensors in more than a dozen critical transformers, each of these transformer containing 8 probes. In one case the unit was equipped with 48 fiber optic sensors in the scope of a large investigation to provide the full picture of temperature distribution inside the transformer. The characteristics of this unit are summarized as follows:
• Type:               Converter-transformer,
                          ODAF cooling
• Rated power:        107 MVA, single-phase
• Line winding:        230/?3 kV, 810 A,
                                grounded Y
• Valve winding:      127/?3 kV, 1468 A, Y
• Tertiary:                18.2 kV
The transformer is a directed-flow type, with oil forced directly in the windings. All pumps are continuously in service while the fans are set in two stages. One set is hand-operated and was continuously operated during the period reported here. The other set is in automatic mode and is turned on when the winding temperature reaches 50 °C. The transformer is shown in Figure 8. As part of its normal duty, this transformer undergoes significant load variations, as can be seen on Figure 9. The load demand fluctuations and the periodic connection of a large synchronous condenser result in a daytime load of typically 1 p.u. and nighttime load of 0.4 p.u. These wide load variations allow for a better evaluation of the dynamic behavior of the winding hot-spot temperature model proposed in the standards.
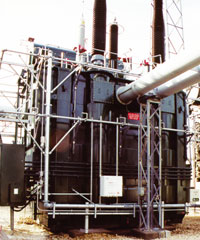
Figure 8 – Fiber optic temperature sensor on a 107MVA converter transformer
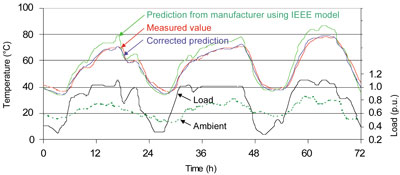
Figure 9 - Winding Hot-Spot Temperature Model on a 107-MVA Converter-Transformer
For this winding, the rated hot-spot rise above top-oil was estimated by the manufacturer to be 25 °C. For the winding exponent, the IEEE and IEC guides recommend for directed flow the use of m=1. It can be seen that with these values the winding hot-spot temperature calculated from manufacturer prediction and classical model can be off by about 7 degree at rated load. This would lead to about 14 degree at 150% overloading. Fiber optic temperature sensor provides a much more dependable temperature value. Even then, it might be useful to have a valid model for prediction purpose. This can be achieved by adjusting the rated hot-spot rise, the winding exponent and the winding thermal time constant. It is then possible to take full advantage of the
loading capability, maintain service during contingency or to carry additional load to take advantage of market opportunity.
Reinforcement of Overloading Capability
Most power transformers have inherently some margin of overloading capability. The rated capacity of a unit is basically the load level that will result in internal temperatures not exceeding the limits set forth by industry standard such as the IEEE and IEC. The application of loads in excess of the nameplate rating involves a degree of risk and accelerated aging. These effects are discussed at length in the IEEE and IEC loading guides (1-2) and can be summarized as follows:
• For long-duration overloads, the main consequence is the thermal aging of the solid insulation.
• For short-term transformer failures, the main risk is the reduction of dielectric strength due to the release of gas bubbles in regions of high electrical stress. The probability of occurrence of these bubbles is closely related to the winding hot-spot temperature and the moisture content of the insulating paper.
• Under overloading conditions, some components such as LTC contacts and bushing connections may develop high temperatures leading to thermal runaway.
It is generally recognized that the risks associated with overloading can be significantly reduced if the transformer conditions are closely monitored throughout the overload period (6-7). Monitoring of winding hot-spot temperature and dissolved gas-in-oil and furan-in-oil provides a major support to the operator when the transformer faces overload conditions. On-line monitoring of winding temperature can provide a dynamic evaluation of insulation degradation and the relative loss of life can then be converted into cost. The cost attributed to loss of life needs to be subtracted from the apparent benefits achieved from transmitting this extra load. The loss of life cost can also be useful when calculating the cost of transmitting this additional amount of energy.
To quantify the benefit of continuous winding temperature monitoring, the additional loading margin provided by monitoring needs to be estimated. Field experience with transformer overloading is still limited, but as a first approximation, it can be conservatively assumed that if the parameters mentioned above are properly monitored, the transformer can carry an extra 10% loading with the same degree of confidence that would exist in operation without monitoring. Thus, the value of a monitoring system can be compared directly with the value of additional transformer capacity made available by the monitoring system. However this rough approach neglects the additional loss of life that would be incurred when operating at high temperature.
A better approach would be to calculate the economic benefit that would ensue from using the additional loading capability to take advantage of market opportunities. As a numerical example, assume that a 100MVA transformer could be requested to carry a 10% overload, for about 5% of the time, when the market condition are attractive. Assuming an ambient temperature of 30°C, the calculation of benefit, including allocation for loss of life would unfold as follows:
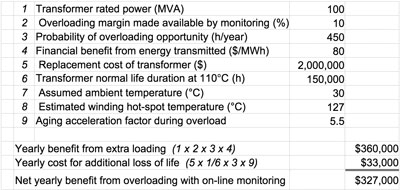
This rough calculation assumes steady temperature conditions during overload but it allows us to show the magnitude of benefit that can be expected from using the transformer full loading capability under adequate control. Conclusions Loading capability of power transformers is limited mainly by winding temperature. It has been the practice to assess this temperature from a measurement of oil temperature at the top of the tank with an added value calculated from load current and winding characteristics. With more frequent occurrence of overloading, it has been found that this simplified approach is not suitable for several types of overload and transformer design.
In an attempt to close this gap, IEEE and IEC loading guides are being revised with more sophisticated models aiming at a better representation of oil temperature inside the winding, considering variations in winding resistance, oil viscosity and oil inertia. Still, direct measurement of winding temperature with fiber optic sensor provides a definitive advantage over a value calculated from uncertain parameters provided by the manufacturer and uncertain equations characterizing the cooling pattern.
In response to this important need, fiber optic sensors have significantly improved to the point that direct measurement of winding temperature is now becoming the preferred method to measure this critical parameter. Compatibility of fragile fiber optic sensor with transformer factory environment has been a problem in the past but is now resolved with sturdy fiber jackets, proper spooling of sensor during factory work, and simplified through-wall connection.
Fiber optic sensors have reached maturity for application in power transformers and should become a standard feature for new transformers. Immediate knowledge of winding hot-spot temperature provides the necessary confidence to carry through overload occurrences and reaps full benefit from this asset.
References
1. IEEE C57.91 1995 “IEEE Guide for Loading Mineral-Oil-Immersed Transformers”
2. IEC 60076-7 “Power Transformer -Part 7: Loading Guide for Oil-Immersed Power Transformers”
3. IEEE C57.145 “Guide for the Definition of Thermal Duplicate Liquid-Immersed Distribution, Power and Regulating Transformer”
4. IEEE 1538-2000 “ IEEE Guide for Determination of maximum Winding Temperature Rise in Liquid-Filled Transformers”
5. CIGRE Working Group 09 of Study Committee 12 “Direct Measurement of the Hot-Spot Temperature of Transformers” Cigre ELECTRA, No 129, pp47-51, March 1990
6. W.J. Bergman, “Equipment Monitoring Selection as Part of Substation Automation” Panel Session, IEEE Winter Power Meeting, New York, 1999
7. T. Molinski, “Minimizing the Life Cycle Cost of Power Transformers”, CIGRE Colloquium, June 2001, Dublin, Ireland