
Motivation for Performing Frequency Response Analysis (FRA) Measurements
Many dielectric and mechanical failures in large power transformers are preceded by mechanical changes in the winding structure. These changes, or displacements in the winding structure, may be the result of transportation damage occurring between the manufacturer and the service location, short circuit forces imposed on the windings resulting from a low impedance fault occurring close to the transformer, or natural effects of aging on the insulating structures used to support the windings. Detection of these displacements in advance of a dielectric failure can reduce unplanned maintenance costs, and provide the possibility to improve system reliability by preventing outages. Additionally, when damage is discovered, repairs may be targeted to a specific phase winding.
Background of Frequency Response Analysis Used in Transformer Diagnostics
The idea of using frequency response analysis to monitor the condition of critical power transformers running in the transmission and distribution network is not a new one. The knowledge that the AC impedance (or admittance) of any RLC network is a function of frequency is almost as old as the discipline of electrical power engineering itself. The realization that the impedance (admittance) versus frequency characteristic of certain critical power system equipment might be used as a diagnostic tool to assess the electrical and mechanical condition of the equipment is a somewhat newer development. Over the past approximately 30 years, much work has been done to try to understand how to first obtain and then to use the powerful information contained in what electrical engineers refer to as the “Transfer Function”.
Transfer function is a generic term defined by the IEEE Standard Dictionary as “a complex frequency response function that defines the dynamic characteristics of a constant parameter linear system. For an ideal system, the transfer function is the ratio of the Fourier transform of the output to that of a given input.”
In general, an engineer may define a transfer function based on inputs and outputs that he or she selects. In order for this notion to have value when assessing the condition of large power transformers, the input and output used to calculate the transfer function must be practically measurable, and the chosen inputs and outputs must exhibit some change when the parameter of interest, such as the geometric structure of the windings, changes. As it turns out, the traditional electrical engineering interpretation of AC impedance (or admittance) as a function of frequency, especially at relatively high frequencies in the range of 100 kHz to 5 MHz, has been shown to be highly sensitive to even minor displacements in the geometric structure of large power transformer windings. In fact, even changes in the dielectric parameters of the insulation system, such as those affected by the temperature and moisture content of the insulating oil and cellulose paper, have the possibility of being revealed through relatively inexpensive FRA measurements.
The Objectives for FRA Measurements
Large power transformers represent a complex RLC network. For such a fixed electromechanical system, the frequency response represents a unique characteristic or fingerprint that may be used to assess the electrical and mechanical condition of the unit. From a theoretical standpoint, the above statement is straightforward. In practice however, the realization of a technique that can produce meaningful results is more complex, especially at frequencies above 2 MHz. The objective of FRA measurement is therefore twofold, and is stated in the following questions:
The remainder of this article will attempt to answer these questions, with emphasis on newly developed techniques for improving the repeatability, sensitivity, and interpretation of results.
Traditional Methods of Obtaining Transfer Functions Through Measurement
There have been two basic methods used in the past to measure the low voltage frequency response on power transformers:
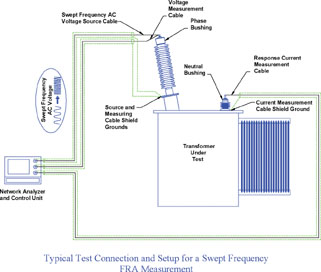
Swept Frequency Method
The first method, known as the swept frequency method, makes use of the simple truth that the sinusoidal AC impedance (or admittance) of a transformer winding varies with frequency.
Traditionally, a network analyzer is used to apply a sinusoidal AC voltage to one terminal of a transformer winding, while the resulting response current is measured via conversion to a voltage at the 50 ohm input to the network analyzer. The frequency is then swept over the range of interest, and a transfer function is directly measured when the admittance (magnitude and phase angle) of the winding is plotted as a function of frequency.
This method is, from an intuitive point of view, the most straightforward means of measuring a transfer function, which may be considered a benefit of this technique. There are however some serious practical difficulties associated with this technique when it is applied to large power transformers. These measurements have traditionally been made using a network analyzer that applies a low amplitude AC voltage (10 volts for example), to the test object. At very low frequencies (in the range of some hundreds of Hz to low kHz), these instruments tend to lack sufficient power to appreciably excite a large power transformer, due to the heavy inductive load presented by the steel core. At very high frequencies (in the range of 2 MHz to 5 MHz), sufficient power may be lacking due to the heavy capacitive load presented by the high capacitance of the winding insulation system. The resulting low signal levels in the response voltage may result in high measurement error, and poor repeatability. This problem is especially troublesome on transformer windings with low series inductive impedance, as commonly encountered on high current windings.
An additional limitation associated with the use of the network analyzer is that the response current must flow over the length of the measurement cable (usually 50 feet or more when connecting to large power transformer bushings) back to the network analyzer, where it is converted to a voltage via the 50 ohm input impedance of the instrument. This technique by design inserts the current measuring cable impedance in series with the transformer winding under test, thereby making the result highly dependent on the particular length and characteristics of the cable. In addition, the relatively high 50 ohm impedance significantly damps the high frequency portion of the FRA response. The result is poor sensitivity in the upper frequency ranges, and poor repeatability whenever the test is repeated with different measuring cables. In some cases, the true frequency response of the transformer above 2 MHz may be completely attenuated by the limitations associated with the measurement technique.
Traditional Impulse Method
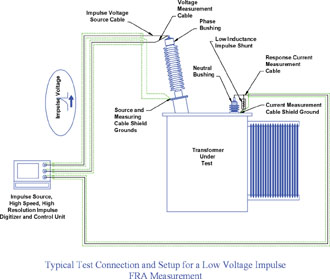
The second method of measuring a transfer function, the traditional low voltage impulse method, makes use of Fourier analysis to arrive at a transfer function through the results of a low voltage impulse test.
In this technique, an impulse is applied to one terminal of the winding under test, and the resulting current is measured immediately at the transformer by means of a voltage developing, low inductance impulse shunt connected in series with a second terminal of the winding under test. The value of the shunt may be selected to produce much less damping of the high frequency response than is possible with the 50 ohm input impedance of a network analyzer. The impulse amplitude is typically some tens of volts to several hundred volts, with a maximum rise time that corresponds to 1 divided by the highest frequency to be considered in the FRA. This means that for a frequency response up to 5 MHz, the exciting impulse must have a rise time of less than 200 ns. Test circuit ground is considered to be the tank of the transformer under test.
The traditional technique is to measure and record the exciting impulse and the resulting response current using a digitizer with sufficient amplitude resolution (generally accepted as at least 9 bit, or 1 part in 512 resolution), and sufficient sampling rate to preserve the highest frequency to be included in the transfer function result. Once the time domain record of the voltage (input) and current (output) are recorded, the transfer function is calculated as the Fast Fourier Transform (FFT) of the output divided by the FFT of the input.
One great strength of this technique is that the applied voltage and resulting response current are physically measured at the transformer. Unlike the swept frequency method, this method is minimally intrusive as far as the impact that the measuring cables have on the true impulse response of the transformer, as long as a proper, repeatable, low inductance connection is placed from the response current measuring terminal to ground.
Although this method has the potential to produce a much better representation of the transformer’s true frequency response, there are again several practical problems with the application of this technique which make it difficult to achieve repeatable results. Chief among these is the sensitivity to noise influences that may have a drastic effect on the transfer function result. In order to reduce the influence of noise, the traditional approach has been to average the results of a series of applied impulses (for example ten impulses) in the time domain, and then perform the FFT on the time domain averaged results. It turns out however that the resulting frequency response produced by this method of time domain averaging is very sensitive to even minor time domain differences in the impulse wave shapes. Achieving repeatable results using this technique has therefore necessitated the use of expensive impulse source equipment, capable of producing a series of precisely repeatable impulses, both with regard to wave shape and time between applications. This traditional low voltage impulse method therefore, while having some distinct advantages over swept frequency, is not easy to apply in a way that repeatable results can be achieved, especially in noisy field environments.
A New FRA Measurement Technique
Modern computational methods and high speed, high resolution, low cost digitizers have made sensitive, high quality FRA measurement much more achievable than in the past. A patented new technique developed by the National Electrical Energy Testing Research and Applications Center (NEETRAC), a center of Georgia Institute of Technology, promises both the possibility of a highly repeatable FRA result, as well as an objective software evaluation package to assist in interpreting the data gathered.
The new technique is based on the low voltage impulse method, which overall can be shown to best preserve the frequency response of the transformer itself, with minimal dependence on lead characteristics when compared to the swept frequency method. Although the test voltage type (impulse) and the test connections are the same as those used in the traditional impulse method, the method of calculating the transfer function is completely different when compared to the traditional ratio of the FFT of the output to the FFT of the input. The quality and repeatability of the results show great improvements over past techniques. Key points of the new method are listed below:
In this technique, averaging is still employed to reduce the influence to noise and random error, however applying the averaging after the transformation to the frequency domain effectively removes the sensitivity to slight variations in the time domain impulse records. This was the greatest limitation in the traditional low voltage impulse method.
The possibility to vary the impulse shape without introducing serious time domain averaging errors into the transfer function result means that impulses with different power levels at different frequencies may be applied. Using the new technique, the impulse shape is intentionally varied over the application of the ten impulses per winding connection. This eliminates the need for an expensive impulse source, while at the same time improving the repeatability. The overall transfer function result is improved by averaging the response of the test object to a number of applied impulses having varying amounts of power residing in the different frequencies. The result is that the repeatability of the final transfer function calculated using SDE’s is enhanced if the ten applied impulses are different in the time domain.
Interpretation of FRA Test Results
In general, FRA relies on the principle that the impedance (or admittance) versus frequency characteristic exhibits resonances, or peaks, at locations in the frequency domain where certain inductive and capacitive reactances that make up the equivalent circuit for the transformer are numerically equal in ohms, or alternatively their admittances are numerically equal in Siemens (or “mhos” as engineers in North America might recognize).
Since the true transfer function of a large power transformer is not known, analysis of FRA test results always involves comparing two or more measured FRA responses. Traditionally, this has been the comparison of two FRA results obtained at different times on the same transformer, or perhaps FRA results obtained from sister units – transformers of the same design whose frequency response characteristics are expected to be similar.
Following a brief summary of traditional interpretation techniques, a new method will be discussed that quantifies the FRA result. Of greatest significance is the possibility this new interpretation technique offers to make a conclusion as to the condition of a transformer, even without historical data or the availability of a sister unit for comparison.
Traditional Interpretation of FRA Results
Traditional methods of interpretation have been purely subjective, with a high degree of expertise required to judge whether a difference in FRA results is detrimental to the transformer. There is little to say on this subject since little progress has been made on the interpretation question until very recently. When comparing two transfer functions, the general approach has been to look at the location (frequency) of the resonant peaks in the transfer function magnitude plot. Shifts in frequency of a particular resonant peak, or the appearance or disappearance of peaks in the transfer function at a particular frequency represent cause for concern. In the past, it has really required the experience of an engineer in interpreting FRA test records to make a judgment as to whether a difference is significant enough to merit further testing and inspection of the transformer prior to energization in the network.
A New Approach to Interpretation of FRA Results
The lack of any objective comparison between two transfer functions has traditionally been one of the primary limitations associated with all diagnostic FRA techniques. A method of evaluating the difference between transfer functions has been developed at NEETRAC that provides a single condition number or Weighted Normalized Difference (WND) to quantify the difference between any two transfer functions being compared.
The key points of the WND calculation are as follows:
The error function is based on a coherence function calculation that estimates the linearity of the transfer function result at each frequency. This information is used to devalue the contribution to the total WND number in frequencies where a poor input to output coherence is recognized.
The WND numbers have been divided into three ranges as follows:
These ranges were determined based on extensive development testing, and have proven to be good reference values for use in both field and laboratory tests, to indicate the significance of the winding deformation existing within the transformer.
The Concept of Objective Winding Asymmetry (OWA)
Perhaps the most significant outcome of this technology is the ability to perform an objective comparison between transfer functions obtained from different phases of three phase transformers. This technique, also patented, has proven successful in detecting damages in three-phase transformers when no historical data is available. Geometric symmetries that exist in typical threephase core form transformer designs can be used to draw conclusions when comparing transfer functions across phases. Comparison of WND numbers across phases has been shown to have the ability to identify individual windings that have shifted, even when no past FRA fingerprint is available for comparison.
The OWA technique has also been shown to have significant value when comparing to historical data. In many cases, differences in the condition of the oil, or even differences in temperature can lead to differences in the transfer function that may be difficult to distinguish from differences resulting from mechanical changes. In this instance, the phase to phase characteristics that are highlighted by the OWA analysis have proven to be considerably less sensitive to variables such as oil condition and temperature, owing to the fact that such changes affect the phase to phase comparisons equally, and therefore the overall effect of the variable change is somewhat cancelled out in the OWA analysis.
In OWA analysis, the WND numbers are calculated in the same manner as presented earlier in this article. The difference is that instead of comparing results taken on different dates or from sister units, each high voltage winding is compared to the other two high voltage windings on the same transformer, and similarly, each low voltage winding is compared to the other two low voltage windings. The OWA is given in percent and is defined by the average of the highest two WND numbers divided by the lowest WND number for the 3 separate winding phase comparisons. Then subtract one from the result and convert to percent.
Through extensive development testing, the following ranges of acceptability have been established for three phase core form type transformers.
These ranges have been developed through analysis of field testing results on transformers ranging from a few MVA up to approximately 500 MVA.
The Future of FRA Testing
The power of frequency response analysis to look into large power transformers and detect mechanical damages is evident. The future of this technology looks positive, with significant new developments that hold the promise of greater sensitivity and repeatability than were previously thought possible. Constant advancements in high speed low cost digitizer technology will aid the improvement of this method of predictive maintenance.
In addition, new evaluation techniques that make use of powerful computational software packages will lead to increased opportunities to provide objective comparison of results. Over time, these objective comparison techniques will replace the old subjective methods of comparison that rely heavily on expert analysis. New technologies that offer these improved techniques will set the course for the future of FRA as a viable testing tool.
Many dielectric and mechanical failures in large power transformers are preceded by mechanical changes in the winding structure. These changes, or displacements in the winding structure, may be the result of transportation damage occurring between the manufacturer and the service location, short circuit forces imposed on the windings resulting from a low impedance fault occurring close to the transformer, or natural effects of aging on the insulating structures used to support the windings. Detection of these displacements in advance of a dielectric failure can reduce unplanned maintenance costs, and provide the possibility to improve system reliability by preventing outages. Additionally, when damage is discovered, repairs may be targeted to a specific phase winding.
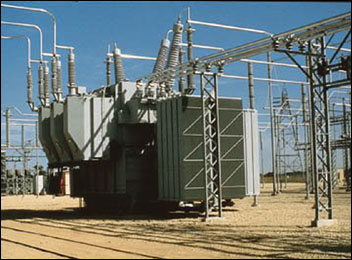
440 MVA Three Phase Auto GSU Transformer Being Prepared for an FRA Test
Background of Frequency Response Analysis Used in Transformer Diagnostics
The idea of using frequency response analysis to monitor the condition of critical power transformers running in the transmission and distribution network is not a new one. The knowledge that the AC impedance (or admittance) of any RLC network is a function of frequency is almost as old as the discipline of electrical power engineering itself. The realization that the impedance (admittance) versus frequency characteristic of certain critical power system equipment might be used as a diagnostic tool to assess the electrical and mechanical condition of the equipment is a somewhat newer development. Over the past approximately 30 years, much work has been done to try to understand how to first obtain and then to use the powerful information contained in what electrical engineers refer to as the “Transfer Function”.
Transfer function is a generic term defined by the IEEE Standard Dictionary as “a complex frequency response function that defines the dynamic characteristics of a constant parameter linear system. For an ideal system, the transfer function is the ratio of the Fourier transform of the output to that of a given input.”
In general, an engineer may define a transfer function based on inputs and outputs that he or she selects. In order for this notion to have value when assessing the condition of large power transformers, the input and output used to calculate the transfer function must be practically measurable, and the chosen inputs and outputs must exhibit some change when the parameter of interest, such as the geometric structure of the windings, changes. As it turns out, the traditional electrical engineering interpretation of AC impedance (or admittance) as a function of frequency, especially at relatively high frequencies in the range of 100 kHz to 5 MHz, has been shown to be highly sensitive to even minor displacements in the geometric structure of large power transformer windings. In fact, even changes in the dielectric parameters of the insulation system, such as those affected by the temperature and moisture content of the insulating oil and cellulose paper, have the possibility of being revealed through relatively inexpensive FRA measurements.
The Objectives for FRA Measurements
Large power transformers represent a complex RLC network. For such a fixed electromechanical system, the frequency response represents a unique characteristic or fingerprint that may be used to assess the electrical and mechanical condition of the unit. From a theoretical standpoint, the above statement is straightforward. In practice however, the realization of a technique that can produce meaningful results is more complex, especially at frequencies above 2 MHz. The objective of FRA measurement is therefore twofold, and is stated in the following questions:
- How can a repeatable transfer function be obtained through practical measurement techniques?
- Once the FRA result is obtained, how can it be interpreted to explain what it means for the transformer?
The remainder of this article will attempt to answer these questions, with emphasis on newly developed techniques for improving the repeatability, sensitivity, and interpretation of results.
Traditional Methods of Obtaining Transfer Functions Through Measurement
There have been two basic methods used in the past to measure the low voltage frequency response on power transformers:
Swept Frequency Method
The first method, known as the swept frequency method, makes use of the simple truth that the sinusoidal AC impedance (or admittance) of a transformer winding varies with frequency.
Traditionally, a network analyzer is used to apply a sinusoidal AC voltage to one terminal of a transformer winding, while the resulting response current is measured via conversion to a voltage at the 50 ohm input to the network analyzer. The frequency is then swept over the range of interest, and a transfer function is directly measured when the admittance (magnitude and phase angle) of the winding is plotted as a function of frequency.
This method is, from an intuitive point of view, the most straightforward means of measuring a transfer function, which may be considered a benefit of this technique. There are however some serious practical difficulties associated with this technique when it is applied to large power transformers. These measurements have traditionally been made using a network analyzer that applies a low amplitude AC voltage (10 volts for example), to the test object. At very low frequencies (in the range of some hundreds of Hz to low kHz), these instruments tend to lack sufficient power to appreciably excite a large power transformer, due to the heavy inductive load presented by the steel core. At very high frequencies (in the range of 2 MHz to 5 MHz), sufficient power may be lacking due to the heavy capacitive load presented by the high capacitance of the winding insulation system. The resulting low signal levels in the response voltage may result in high measurement error, and poor repeatability. This problem is especially troublesome on transformer windings with low series inductive impedance, as commonly encountered on high current windings.
An additional limitation associated with the use of the network analyzer is that the response current must flow over the length of the measurement cable (usually 50 feet or more when connecting to large power transformer bushings) back to the network analyzer, where it is converted to a voltage via the 50 ohm input impedance of the instrument. This technique by design inserts the current measuring cable impedance in series with the transformer winding under test, thereby making the result highly dependent on the particular length and characteristics of the cable. In addition, the relatively high 50 ohm impedance significantly damps the high frequency portion of the FRA response. The result is poor sensitivity in the upper frequency ranges, and poor repeatability whenever the test is repeated with different measuring cables. In some cases, the true frequency response of the transformer above 2 MHz may be completely attenuated by the limitations associated with the measurement technique.
Traditional Impulse Method
The second method of measuring a transfer function, the traditional low voltage impulse method, makes use of Fourier analysis to arrive at a transfer function through the results of a low voltage impulse test.
In this technique, an impulse is applied to one terminal of the winding under test, and the resulting current is measured immediately at the transformer by means of a voltage developing, low inductance impulse shunt connected in series with a second terminal of the winding under test. The value of the shunt may be selected to produce much less damping of the high frequency response than is possible with the 50 ohm input impedance of a network analyzer. The impulse amplitude is typically some tens of volts to several hundred volts, with a maximum rise time that corresponds to 1 divided by the highest frequency to be considered in the FRA. This means that for a frequency response up to 5 MHz, the exciting impulse must have a rise time of less than 200 ns. Test circuit ground is considered to be the tank of the transformer under test.
The traditional technique is to measure and record the exciting impulse and the resulting response current using a digitizer with sufficient amplitude resolution (generally accepted as at least 9 bit, or 1 part in 512 resolution), and sufficient sampling rate to preserve the highest frequency to be included in the transfer function result. Once the time domain record of the voltage (input) and current (output) are recorded, the transfer function is calculated as the Fast Fourier Transform (FFT) of the output divided by the FFT of the input.
One great strength of this technique is that the applied voltage and resulting response current are physically measured at the transformer. Unlike the swept frequency method, this method is minimally intrusive as far as the impact that the measuring cables have on the true impulse response of the transformer, as long as a proper, repeatable, low inductance connection is placed from the response current measuring terminal to ground.
Although this method has the potential to produce a much better representation of the transformer’s true frequency response, there are again several practical problems with the application of this technique which make it difficult to achieve repeatable results. Chief among these is the sensitivity to noise influences that may have a drastic effect on the transfer function result. In order to reduce the influence of noise, the traditional approach has been to average the results of a series of applied impulses (for example ten impulses) in the time domain, and then perform the FFT on the time domain averaged results. It turns out however that the resulting frequency response produced by this method of time domain averaging is very sensitive to even minor time domain differences in the impulse wave shapes. Achieving repeatable results using this technique has therefore necessitated the use of expensive impulse source equipment, capable of producing a series of precisely repeatable impulses, both with regard to wave shape and time between applications. This traditional low voltage impulse method therefore, while having some distinct advantages over swept frequency, is not easy to apply in a way that repeatable results can be achieved, especially in noisy field environments.
A New FRA Measurement Technique
Modern computational methods and high speed, high resolution, low cost digitizers have made sensitive, high quality FRA measurement much more achievable than in the past. A patented new technique developed by the National Electrical Energy Testing Research and Applications Center (NEETRAC), a center of Georgia Institute of Technology, promises both the possibility of a highly repeatable FRA result, as well as an objective software evaluation package to assist in interpreting the data gathered.
The new technique is based on the low voltage impulse method, which overall can be shown to best preserve the frequency response of the transformer itself, with minimal dependence on lead characteristics when compared to the swept frequency method. Although the test voltage type (impulse) and the test connections are the same as those used in the traditional impulse method, the method of calculating the transfer function is completely different when compared to the traditional ratio of the FFT of the output to the FFT of the input. The quality and repeatability of the results show great improvements over past techniques. Key points of the new method are listed below:
- Individual impulses are applied, with each impulse and its resulting response current recorded as a time domain signal, for a series of ten impulses per winding connection.
- An auto spectral density estimate (SDE) is computed separately in software for each of the ten voltage and current pulse pairs recorded. In addition a cross SDE is computed for each voltage / current pulse pair. These SDE’s may be thought of as a representation of the power present in the measured impulses, as a function of frequency.
- Once ten pulse pairs have been acquired and their respective auto and cross spectra computed, an average frequency domain SDE is computed over the ten pulses acquired.
- The transfer function is calculated as the ratio of the average cross spectra to the average auto spectra.
In this technique, averaging is still employed to reduce the influence to noise and random error, however applying the averaging after the transformation to the frequency domain effectively removes the sensitivity to slight variations in the time domain impulse records. This was the greatest limitation in the traditional low voltage impulse method.
The possibility to vary the impulse shape without introducing serious time domain averaging errors into the transfer function result means that impulses with different power levels at different frequencies may be applied. Using the new technique, the impulse shape is intentionally varied over the application of the ten impulses per winding connection. This eliminates the need for an expensive impulse source, while at the same time improving the repeatability. The overall transfer function result is improved by averaging the response of the test object to a number of applied impulses having varying amounts of power residing in the different frequencies. The result is that the repeatability of the final transfer function calculated using SDE’s is enhanced if the ten applied impulses are different in the time domain.
Interpretation of FRA Test Results
In general, FRA relies on the principle that the impedance (or admittance) versus frequency characteristic exhibits resonances, or peaks, at locations in the frequency domain where certain inductive and capacitive reactances that make up the equivalent circuit for the transformer are numerically equal in ohms, or alternatively their admittances are numerically equal in Siemens (or “mhos” as engineers in North America might recognize).
Since the true transfer function of a large power transformer is not known, analysis of FRA test results always involves comparing two or more measured FRA responses. Traditionally, this has been the comparison of two FRA results obtained at different times on the same transformer, or perhaps FRA results obtained from sister units – transformers of the same design whose frequency response characteristics are expected to be similar.
Following a brief summary of traditional interpretation techniques, a new method will be discussed that quantifies the FRA result. Of greatest significance is the possibility this new interpretation technique offers to make a conclusion as to the condition of a transformer, even without historical data or the availability of a sister unit for comparison.
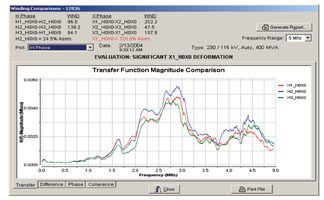
Example of FRA Analysis Using Modern Software to Perform Objective Analysis Techniques
Traditional Interpretation of FRA Results
Traditional methods of interpretation have been purely subjective, with a high degree of expertise required to judge whether a difference in FRA results is detrimental to the transformer. There is little to say on this subject since little progress has been made on the interpretation question until very recently. When comparing two transfer functions, the general approach has been to look at the location (frequency) of the resonant peaks in the transfer function magnitude plot. Shifts in frequency of a particular resonant peak, or the appearance or disappearance of peaks in the transfer function at a particular frequency represent cause for concern. In the past, it has really required the experience of an engineer in interpreting FRA test records to make a judgment as to whether a difference is significant enough to merit further testing and inspection of the transformer prior to energization in the network.
A New Approach to Interpretation of FRA Results
The lack of any objective comparison between two transfer functions has traditionally been one of the primary limitations associated with all diagnostic FRA techniques. A method of evaluating the difference between transfer functions has been developed at NEETRAC that provides a single condition number or Weighted Normalized Difference (WND) to quantify the difference between any two transfer functions being compared.
The key points of the WND calculation are as follows:
- The arithmetic difference between transfer function magnitudes is computed at each frequency.
- Each data point is normalized.
- Each data point is weighted according to an error function at that frequency.
- WND = a constant times the average of the weighted values.
The error function is based on a coherence function calculation that estimates the linearity of the transfer function result at each frequency. This information is used to devalue the contribution to the total WND number in frequencies where a poor input to output coherence is recognized.
The WND numbers have been divided into three ranges as follows:
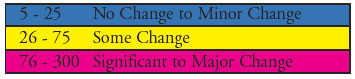
These ranges were determined based on extensive development testing, and have proven to be good reference values for use in both field and laboratory tests, to indicate the significance of the winding deformation existing within the transformer.
The Concept of Objective Winding Asymmetry (OWA)
Perhaps the most significant outcome of this technology is the ability to perform an objective comparison between transfer functions obtained from different phases of three phase transformers. This technique, also patented, has proven successful in detecting damages in three-phase transformers when no historical data is available. Geometric symmetries that exist in typical threephase core form transformer designs can be used to draw conclusions when comparing transfer functions across phases. Comparison of WND numbers across phases has been shown to have the ability to identify individual windings that have shifted, even when no past FRA fingerprint is available for comparison.
The OWA technique has also been shown to have significant value when comparing to historical data. In many cases, differences in the condition of the oil, or even differences in temperature can lead to differences in the transfer function that may be difficult to distinguish from differences resulting from mechanical changes. In this instance, the phase to phase characteristics that are highlighted by the OWA analysis have proven to be considerably less sensitive to variables such as oil condition and temperature, owing to the fact that such changes affect the phase to phase comparisons equally, and therefore the overall effect of the variable change is somewhat cancelled out in the OWA analysis.
In OWA analysis, the WND numbers are calculated in the same manner as presented earlier in this article. The difference is that instead of comparing results taken on different dates or from sister units, each high voltage winding is compared to the other two high voltage windings on the same transformer, and similarly, each low voltage winding is compared to the other two low voltage windings. The OWA is given in percent and is defined by the average of the highest two WND numbers divided by the lowest WND number for the 3 separate winding phase comparisons. Then subtract one from the result and convert to percent.
Through extensive development testing, the following ranges of acceptability have been established for three phase core form type transformers.
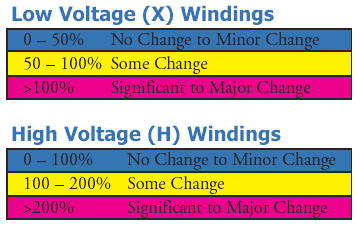
These ranges have been developed through analysis of field testing results on transformers ranging from a few MVA up to approximately 500 MVA.
The Future of FRA Testing
The power of frequency response analysis to look into large power transformers and detect mechanical damages is evident. The future of this technology looks positive, with significant new developments that hold the promise of greater sensitivity and repeatability than were previously thought possible. Constant advancements in high speed low cost digitizer technology will aid the improvement of this method of predictive maintenance.
In addition, new evaluation techniques that make use of powerful computational software packages will lead to increased opportunities to provide objective comparison of results. Over time, these objective comparison techniques will replace the old subjective methods of comparison that rely heavily on expert analysis. New technologies that offer these improved techniques will set the course for the future of FRA as a viable testing tool.