
Causal Relationships
There are approximately 100,000 power transformers in use in North America today. Worldwide the count is close to 500,000. Power transformers are an expensive asset that generally cost between $100K and $4M each, depending on their size and application, among other factors. In the realm of transmission and distribution they typically represent the highest valued assets of the system. There is no doubt that power transformers are critical components of the electrical grid and the power generation system.
The demand placed on these critical components continues to increase. Deregulation has led to large increases in generation capacity with little consideration given to transmission capacity. This has led to a decrease in the reliability of power delivery and an increase in the likelihood of major blackouts as safety margins disappear and the age of these key assets continue to increase.
The direct cost of failure includes the cost of replacement equipment, environmental cleanup, and replacement power purchased on the spot market; in areas with many industrial and large commercial customers costs can also include penalties for the unplanned outage. At the highest level of the electrical infrastructure, reliability has been achieved through redundancy. However, even when redundancy exists there are impacts due to failure. The financial impact may be much greater to the consumer than to the utility. Even with redundancy, switching interruptions resulting from a failure can have a major impact on many customers. Industries based on process controls may lose data or be forced to shutdown as a result of such transients. The costs to industrial and financial customers, when long outages occur, are dramatic. Such costs are now beginning to be discussed in terms of tariffs and associated penalties for utilities not delivering reliable power.
Monitoring the state of health of power transformers, a key component in the path of reliable power, has traditionally been performed using routine Dissolved Gas Analysis (DGA) tests performed at annual or semi-annual intervals. Measuring the level and rate of change of combustible gases in transformer insulating oil is an accepted industry practice based on the fact that the presence of combustible gases is a reliable diagnostic tool which is used as indicator of undesirable events in the transformer, such as hot-spots and electrical arcing; events which may portend a future of unreliable performance by the transformer.
By closely monitoring dissolved gas levels many transformer failures can be prevented. Prevention, however, is only possible if the reason for the presence of gases is understood and can be either controlled or corrected by means of repairs or prescribed usage profiles. Relating transformer gassing events to load, temperature, and external system events can be a difficult or even impossible task when only one or two DGA samples per year are available to perform such analysis. Daily on-line monitoring of key gases provides the level of detail required to show causal relationships between gassing and external events in a way that traditional infrequent laboratory sampling cannot.
Can You Trust Your DGA Results?
A 40 year old 500 kV transformer, with a history of accumulated high levels of methane and ethylene, was selected to evaluate on-line continuous DGA monitoring by comparing on-line measurements to laboratory DGA measurements. Because the on-line analyzer provides six gas-in-oil measurements daily it was also possible to use the on-line data to determine if and to what extent gassing of the transformer was load dependent.
Internal examination of the transformer identified carbon deposits between the core frame and the tank wall due to deteriorated insulating material. Repairs were made at that time but gassing continued, leading to a second inspection and degassing. The transformer was returned to service in June 2003 with a Serveron® TrueGas™ analyzer monitoring eight gases every four hours (six samples per day, seven days per week).
Simultaneously, weekly oil samples were submitted to three laboratories over a three month period. Although absolute measurements of gas levels varied between labs and the on-line analyzer, the general trending of the gases were consistent between all measurement sources.
Figure 1 directly compares the on-line DGA measurements with the laboratory measurements. Since the on-line measurements occur at a frequency that is 50x that of the weekly laboratory measurements they appear as continuous lines on this chart. Each color on the chart represents a different gas, as indicated by the legend at the bottom of the chart.
The weekly laboratory measurements are plotted in groups of three (slightly offset from each other on the horizontal axis for clarity). In general, the on-line results intersect or track very closely with the laboratory results. Oxygen (in green) shows the least correlation due to the fact that the laboratory samples are easily contaminated by the atmosphere either during the oil sampling (extraction) process, during transport, or during injection into the laboratory gas chromatograph apparatus.
Can you trust your laboratory DGA results? Yes, other than oxygen (and nitrogen) which can be easily skewed by atmospheric contamination, these three labs and the on-line analyzer provided substantially similar DGA measurements. The absolute values (levels) of the on-line analyzer and laboratory measurements varied, but the trends and direction of the results are consistent.
Transformer Background
The 500 kV transformer which was monitored as a part of this study has shown hot-metal gassing (C2H4, CH4, C2H6, and traces of C2H2) since its initial placement into service just over 40 years ago. The unit has been degassed a number of times during its history of operation. The internal inspection identified the gassing to be associated with deteriorated insulating material used to electrically isolate the core and coil assembly from the tank wall. Attempts were made by the manufacturer to minimize circulating currents, however the problem continued, leading to a second internal inspection and degassing and was returned to service in June of 2003 with a Serveron TrueGas analyzer installed.
Transformer Gassing Problem
The core and coil assembly is held in place with brackets between the core-frame and tank-wall at the four corners, top and bottom, with insulating gaskets to provide electrical isolation. An over-heated spot was found during the initial inspection at one of the lower brackets; indicated by carbon deposits and thermo-vision. Repairs consisted of removing the core-frame to tank-wall grounding strap and reinstalling it to bridge the damaged gasket.
Unfortunately, this did not eliminate the gassing. So a second internal inspection of this transformer was performed and revealed the following:
Service Decision
Following the second inspection it was decided to return the transformer to service on the basis that gassing is probably being caused by circulating currents involving the core frames or another grounding structure. Most importantly, gassing did not appear to involve the windings.
Electrical tests indicated that the transformer was okay. Lifting the core and coil assembly inside the tank or untanking the transformer to attempt to isolate the core-frame ground was considered not worthwhile.
The risk of not finding the problem, not being repairable if found, or of causing further damage to the transformer outweighed the risk of the existing gassing problem. It was decided that on-line DGA monitoring and periodic degassing should enable the transformer to remain in service.
Daily DGA Measurements
The daily sampling associated with on-line monitoring provides a level of detail that is simply not possible using traditional laboratory measurements. With such detail it is possible to correlate DGA results with SCADA measurements and significant events associated with the transformer, such as loading, winding temperature, and LTC adjustments.
The logarithmic chart of on-line DGA measurements shown in figure 2 includes plots of the eight gases which are automatically measured every four hours by the on-line analyzer and one “summation gas” (TDCG, total dissolved combustible gas). The tenth plot, the light green and somewhat softer line near the bottom of the chart, is drawn on a linear scale (its corresponding y-axis scale is not present on the chart) and is a relative indication of the load on the transformer. In addition to the DGA measurements, this data is also automatically collected by the on-line analyzer via its LoadGuide™ input six times each day.
Correlation With Load
By comparing the LoadGuide fluctuations with actual SCADA data one can “calibrate” this relative load line with the true load on the transformer. A plot of the SCADA data representing the load through the transformer bank is shown in figure 3.
The SCADA load data in figure 3 corresponds to two weeks of on-line DGA data collected near the beginning of the plots of figure 2. Aligning the date information on the x-axis of both charts, one can locate within figure 2 the identical load variations near the beginning of the on-line analyzer’s LoadGuide plot (the smooth light green line near the bottom of the chart).
One point that is immediately evident is that continuous on-line monitoring clearly shows combustible gasses being generated by this transformer whenever the transformer load exceeds approximately 50% of nameplate (producing hot-metal gases including acetylene). On-line DGA data acquired from a second identical (sister) transformer in the same bank indicates this load-dependent behavior might be an inherent weakness in the transformer (see figure 4).
If there is a concern that operating at or above a load level that generates gas might pose too great a risk, a simple solution to the problem would be to limit the transformer to operating below the gas generating load level, 50% in this example. When this tactic is not practical, monitoring the generation of gases closely and in real-time whenever the transformer is above the gas generating load level is another approach, with the strategy of diverting load if gassing proves excessive.
Given the well-known history of use and prior gassing levels associated with this transformer the decision to continue to operate at or near the gassing level, while simultaneously collecting daily DGAs using the on-line analyzer, is a prudent choice. As is the case in this example, when it is impossible or impractical to eliminate the source of combustible gases in a transformer, a continuous on-line DGA analyzer can be used to closely monitor the combustible gas generation whenever the transformer must be used at or above the gas generating load level.
Infrequent Sampling Results in Aliasing
Of additional interest is the fact that some of the gases generated as a result of the “excess” load actually dissipate over time. When gasses dissipate timing of the DGA test relative to the events of interest becomes even more important. Sampling too long after an event may result in finding no trace of the gas which was generated, because the gases are no longer present in the oil for measurement by traditional means.
The conventional DGA samples that were taken alongside the on-line analyzer were performed at one week intervals. In any normal scenario this would be considered a very high rate of sampling. If we compare the results of the conventional results with the on-line results, for just acetylene and one of the three laboratories, we see very good correlation (see figure 5).
Without the continuous on-line results plotted alongside the manual results it can be difficult to actually detect the real trend of the acetylene. Certainly it would be hard to make a strong case for correlation of transformer load to acetylene production.
At a more typical (but still aggressive) laboratory sampling rate of one per month the bias associated with the rate and timing of the sample can further affect observations so that correlating gassing events to external events can be impossible to determine. If there is a causal relationship between the two it may in fact be missed due to aliasing of the data resulting from too low a sampling rate. See figure 6 for an example of how sample timing and rate can adversely affect one’s observation of the events.
Conclusions
The high rate of sampling associated with on-line DGA monitoring of both combustible and non-combustible gases can be used to identify causal relationships between transformer gassing and significant events associated with the transformer, such as operating conditions, loading, winding temperature, and LTC adjustments; whereas testing laboratory samples cannot — due to variations in sampling techniques, testing methods, and the aliasing effect that results from low sampling rates. Transformers can escalate beyond their normal gassing level, to unacceptable levels, very quickly (within hours). Such key events can only be tracked with high DGA sampling rates.
When it is impossible or impractical to eliminate the cause of gases in a transformer, continuous on-line DGA data can be used to help define acceptable transformer operation profiles. But use of on-line DGA monitoring need not be limited to “problem” transformers. Transformers that consistently show “no gassing” when operating at nameplate may, in fact, be candidates for safe operation above nameplate ratings. In either case, continuous on-line DGA provides the additional significant information that can be used to extend or safely limit a transformer’s range of operation.
Today, decisions to repair or replace power transformer equipment are based on historical experience, not on real-time data, because much of the information relating to the real-time operating condition of the equipment simply does not exist or is not easily obtained. Continuous on-line DGA data provides significant and useful real-time information regarding the operational characteristics of expensive and critical transformer assets that, when combined with their performance history, allow utilities to prudently operate gassing or overloaded transformers and extend their projected service life.
About the Authors
Stanley R. Lindgren, Director of Product Strategy
stan.lindgren@serveron.com
Stan Lindgren is Director of Product Strategy for Serveron Corporation, Hillsboro, Oregon. Before joining Serveron in February of 2001 Mr. Lindgren was Manager of Power Transformers at EPRI in Palo Alto, California, since 1986. From 1979 to 1986 he was with the Paragon Electric Co. Inc. in Two Rivers, Wisconsin, a subsidiary of AMF Inc., where he was Manager of Strategic Planning and Product Acquisition. At RTE Corporation, Waukesha, Wisconsin, Mr. Lindgren was Product Marketing Manager for RTE's Small Power Transformer Division from 1971-1978. Products were three-phase padmounted, secondary-unit-substation and power transformers, 5000 KVA and below. At Allis Chalmers in Milwaukee, Wisconsin, he held various positions in product application and technical marketing for the Power Transformer Division 1952-1971, involving all types of medium, large, and EHV power transformers. He obtained his Bachelor of Science in Electrical Engineering (Power) from Kansas State University.
Paul Fischer, Product Marketing Manager
paul.fischer@serveron.com
Paul Fischer is Product Marketing Manager for Serveron Corporation in Hillsboro, OR, since 2001. Prior to joining Serveron Mr. Fischer was employed in engineering and marketing roles for companies involved in the embedded computer and application markets, designing and selling equipment primarily for industrial applications. Mr. Fischer has a Bachelors of Science in Engineering from the University of Minnesota, Minneapolis and a Masters of Science in Engineering from the University of California, Berkeley.
There are approximately 100,000 power transformers in use in North America today. Worldwide the count is close to 500,000. Power transformers are an expensive asset that generally cost between $100K and $4M each, depending on their size and application, among other factors. In the realm of transmission and distribution they typically represent the highest valued assets of the system. There is no doubt that power transformers are critical components of the electrical grid and the power generation system.
The demand placed on these critical components continues to increase. Deregulation has led to large increases in generation capacity with little consideration given to transmission capacity. This has led to a decrease in the reliability of power delivery and an increase in the likelihood of major blackouts as safety margins disappear and the age of these key assets continue to increase.
The direct cost of failure includes the cost of replacement equipment, environmental cleanup, and replacement power purchased on the spot market; in areas with many industrial and large commercial customers costs can also include penalties for the unplanned outage. At the highest level of the electrical infrastructure, reliability has been achieved through redundancy. However, even when redundancy exists there are impacts due to failure. The financial impact may be much greater to the consumer than to the utility. Even with redundancy, switching interruptions resulting from a failure can have a major impact on many customers. Industries based on process controls may lose data or be forced to shutdown as a result of such transients. The costs to industrial and financial customers, when long outages occur, are dramatic. Such costs are now beginning to be discussed in terms of tariffs and associated penalties for utilities not delivering reliable power.
Monitoring the state of health of power transformers, a key component in the path of reliable power, has traditionally been performed using routine Dissolved Gas Analysis (DGA) tests performed at annual or semi-annual intervals. Measuring the level and rate of change of combustible gases in transformer insulating oil is an accepted industry practice based on the fact that the presence of combustible gases is a reliable diagnostic tool which is used as indicator of undesirable events in the transformer, such as hot-spots and electrical arcing; events which may portend a future of unreliable performance by the transformer.
By closely monitoring dissolved gas levels many transformer failures can be prevented. Prevention, however, is only possible if the reason for the presence of gases is understood and can be either controlled or corrected by means of repairs or prescribed usage profiles. Relating transformer gassing events to load, temperature, and external system events can be a difficult or even impossible task when only one or two DGA samples per year are available to perform such analysis. Daily on-line monitoring of key gases provides the level of detail required to show causal relationships between gassing and external events in a way that traditional infrequent laboratory sampling cannot.
Can You Trust Your DGA Results?
A 40 year old 500 kV transformer, with a history of accumulated high levels of methane and ethylene, was selected to evaluate on-line continuous DGA monitoring by comparing on-line measurements to laboratory DGA measurements. Because the on-line analyzer provides six gas-in-oil measurements daily it was also possible to use the on-line data to determine if and to what extent gassing of the transformer was load dependent.
Internal examination of the transformer identified carbon deposits between the core frame and the tank wall due to deteriorated insulating material. Repairs were made at that time but gassing continued, leading to a second inspection and degassing. The transformer was returned to service in June 2003 with a Serveron® TrueGas™ analyzer monitoring eight gases every four hours (six samples per day, seven days per week).
Simultaneously, weekly oil samples were submitted to three laboratories over a three month period. Although absolute measurements of gas levels varied between labs and the on-line analyzer, the general trending of the gases were consistent between all measurement sources.
Figure 1 directly compares the on-line DGA measurements with the laboratory measurements. Since the on-line measurements occur at a frequency that is 50x that of the weekly laboratory measurements they appear as continuous lines on this chart. Each color on the chart represents a different gas, as indicated by the legend at the bottom of the chart.
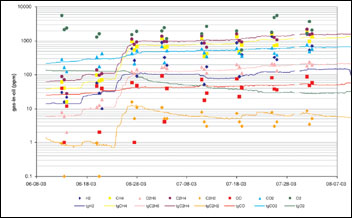
figure 1: weekly DGA results from three different laboratories compared with TrueGas results
The weekly laboratory measurements are plotted in groups of three (slightly offset from each other on the horizontal axis for clarity). In general, the on-line results intersect or track very closely with the laboratory results. Oxygen (in green) shows the least correlation due to the fact that the laboratory samples are easily contaminated by the atmosphere either during the oil sampling (extraction) process, during transport, or during injection into the laboratory gas chromatograph apparatus.
Can you trust your laboratory DGA results? Yes, other than oxygen (and nitrogen) which can be easily skewed by atmospheric contamination, these three labs and the on-line analyzer provided substantially similar DGA measurements. The absolute values (levels) of the on-line analyzer and laboratory measurements varied, but the trends and direction of the results are consistent.
Transformer Background
The 500 kV transformer which was monitored as a part of this study has shown hot-metal gassing (C2H4, CH4, C2H6, and traces of C2H2) since its initial placement into service just over 40 years ago. The unit has been degassed a number of times during its history of operation. The internal inspection identified the gassing to be associated with deteriorated insulating material used to electrically isolate the core and coil assembly from the tank wall. Attempts were made by the manufacturer to minimize circulating currents, however the problem continued, leading to a second internal inspection and degassing and was returned to service in June of 2003 with a Serveron TrueGas analyzer installed.
Transformer Gassing Problem
The core and coil assembly is held in place with brackets between the core-frame and tank-wall at the four corners, top and bottom, with insulating gaskets to provide electrical isolation. An over-heated spot was found during the initial inspection at one of the lower brackets; indicated by carbon deposits and thermo-vision. Repairs consisted of removing the core-frame to tank-wall grounding strap and reinstalling it to bridge the damaged gasket.
Unfortunately, this did not eliminate the gassing. So a second internal inspection of this transformer was performed and revealed the following:
- It was impossible to determine whether another frame ground is providing a path for circulating currents.
- The core was meggered (after lifting the core-to-frame ground) and measured above 1000 megohms, indicating that the core is not grounded and is isolated from the frame.
- Windings and clamping appeared to be tight.
- No carbon deposits were found.
Service Decision
Following the second inspection it was decided to return the transformer to service on the basis that gassing is probably being caused by circulating currents involving the core frames or another grounding structure. Most importantly, gassing did not appear to involve the windings.
Electrical tests indicated that the transformer was okay. Lifting the core and coil assembly inside the tank or untanking the transformer to attempt to isolate the core-frame ground was considered not worthwhile.
The risk of not finding the problem, not being repairable if found, or of causing further damage to the transformer outweighed the risk of the existing gassing problem. It was decided that on-line DGA monitoring and periodic degassing should enable the transformer to remain in service.
Daily DGA Measurements
The daily sampling associated with on-line monitoring provides a level of detail that is simply not possible using traditional laboratory measurements. With such detail it is possible to correlate DGA results with SCADA measurements and significant events associated with the transformer, such as loading, winding temperature, and LTC adjustments.
The logarithmic chart of on-line DGA measurements shown in figure 2 includes plots of the eight gases which are automatically measured every four hours by the on-line analyzer and one “summation gas” (TDCG, total dissolved combustible gas). The tenth plot, the light green and somewhat softer line near the bottom of the chart, is drawn on a linear scale (its corresponding y-axis scale is not present on the chart) and is a relative indication of the load on the transformer. In addition to the DGA measurements, this data is also automatically collected by the on-line analyzer via its LoadGuide™ input six times each day.
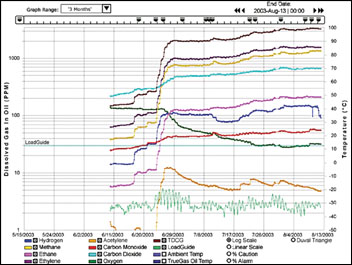
figure 2: 3-month on-line results (log scale) with LoadGuide indicated in light green (linear scale)
Correlation With Load
By comparing the LoadGuide fluctuations with actual SCADA data one can “calibrate” this relative load line with the true load on the transformer. A plot of the SCADA data representing the load through the transformer bank is shown in figure 3.
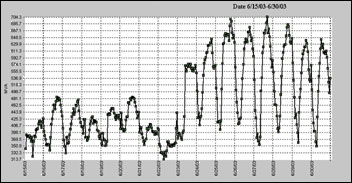
figure 3: SCADA load data through the transformer being monitored
The SCADA load data in figure 3 corresponds to two weeks of on-line DGA data collected near the beginning of the plots of figure 2. Aligning the date information on the x-axis of both charts, one can locate within figure 2 the identical load variations near the beginning of the on-line analyzer’s LoadGuide plot (the smooth light green line near the bottom of the chart).
One point that is immediately evident is that continuous on-line monitoring clearly shows combustible gasses being generated by this transformer whenever the transformer load exceeds approximately 50% of nameplate (producing hot-metal gases including acetylene). On-line DGA data acquired from a second identical (sister) transformer in the same bank indicates this load-dependent behavior might be an inherent weakness in the transformer (see figure 4).
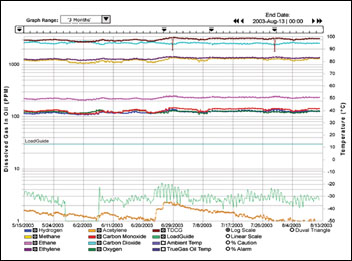
figure 4: sister transformer’s on-line results (log scale) with LoadGuide (linear scale)
If there is a concern that operating at or above a load level that generates gas might pose too great a risk, a simple solution to the problem would be to limit the transformer to operating below the gas generating load level, 50% in this example. When this tactic is not practical, monitoring the generation of gases closely and in real-time whenever the transformer is above the gas generating load level is another approach, with the strategy of diverting load if gassing proves excessive.
Given the well-known history of use and prior gassing levels associated with this transformer the decision to continue to operate at or near the gassing level, while simultaneously collecting daily DGAs using the on-line analyzer, is a prudent choice. As is the case in this example, when it is impossible or impractical to eliminate the source of combustible gases in a transformer, a continuous on-line DGA analyzer can be used to closely monitor the combustible gas generation whenever the transformer must be used at or above the gas generating load level.
Infrequent Sampling Results in Aliasing
Of additional interest is the fact that some of the gases generated as a result of the “excess” load actually dissipate over time. When gasses dissipate timing of the DGA test relative to the events of interest becomes even more important. Sampling too long after an event may result in finding no trace of the gas which was generated, because the gases are no longer present in the oil for measurement by traditional means.
The conventional DGA samples that were taken alongside the on-line analyzer were performed at one week intervals. In any normal scenario this would be considered a very high rate of sampling. If we compare the results of the conventional results with the on-line results, for just acetylene and one of the three laboratories, we see very good correlation (see figure 5).
Without the continuous on-line results plotted alongside the manual results it can be difficult to actually detect the real trend of the acetylene. Certainly it would be hard to make a strong case for correlation of transformer load to acetylene production.
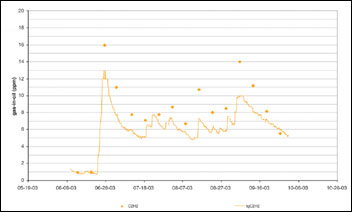
figure 5: on-line and weekly measurements for one laboratory of acetylene (linear scale)
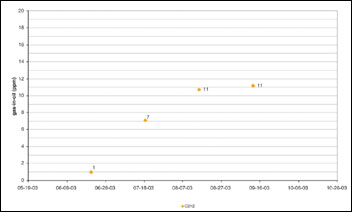
figure 6: laboratory measurements of acetylene at one month intervals (linear scale)
At a more typical (but still aggressive) laboratory sampling rate of one per month the bias associated with the rate and timing of the sample can further affect observations so that correlating gassing events to external events can be impossible to determine. If there is a causal relationship between the two it may in fact be missed due to aliasing of the data resulting from too low a sampling rate. See figure 6 for an example of how sample timing and rate can adversely affect one’s observation of the events.
Conclusions
The high rate of sampling associated with on-line DGA monitoring of both combustible and non-combustible gases can be used to identify causal relationships between transformer gassing and significant events associated with the transformer, such as operating conditions, loading, winding temperature, and LTC adjustments; whereas testing laboratory samples cannot — due to variations in sampling techniques, testing methods, and the aliasing effect that results from low sampling rates. Transformers can escalate beyond their normal gassing level, to unacceptable levels, very quickly (within hours). Such key events can only be tracked with high DGA sampling rates.
When it is impossible or impractical to eliminate the cause of gases in a transformer, continuous on-line DGA data can be used to help define acceptable transformer operation profiles. But use of on-line DGA monitoring need not be limited to “problem” transformers. Transformers that consistently show “no gassing” when operating at nameplate may, in fact, be candidates for safe operation above nameplate ratings. In either case, continuous on-line DGA provides the additional significant information that can be used to extend or safely limit a transformer’s range of operation.
Today, decisions to repair or replace power transformer equipment are based on historical experience, not on real-time data, because much of the information relating to the real-time operating condition of the equipment simply does not exist or is not easily obtained. Continuous on-line DGA data provides significant and useful real-time information regarding the operational characteristics of expensive and critical transformer assets that, when combined with their performance history, allow utilities to prudently operate gassing or overloaded transformers and extend their projected service life.
About the Authors
Stanley R. Lindgren, Director of Product Strategy
stan.lindgren@serveron.com
Stan Lindgren is Director of Product Strategy for Serveron Corporation, Hillsboro, Oregon. Before joining Serveron in February of 2001 Mr. Lindgren was Manager of Power Transformers at EPRI in Palo Alto, California, since 1986. From 1979 to 1986 he was with the Paragon Electric Co. Inc. in Two Rivers, Wisconsin, a subsidiary of AMF Inc., where he was Manager of Strategic Planning and Product Acquisition. At RTE Corporation, Waukesha, Wisconsin, Mr. Lindgren was Product Marketing Manager for RTE's Small Power Transformer Division from 1971-1978. Products were three-phase padmounted, secondary-unit-substation and power transformers, 5000 KVA and below. At Allis Chalmers in Milwaukee, Wisconsin, he held various positions in product application and technical marketing for the Power Transformer Division 1952-1971, involving all types of medium, large, and EHV power transformers. He obtained his Bachelor of Science in Electrical Engineering (Power) from Kansas State University.
Paul Fischer, Product Marketing Manager
paul.fischer@serveron.com
Paul Fischer is Product Marketing Manager for Serveron Corporation in Hillsboro, OR, since 2001. Prior to joining Serveron Mr. Fischer was employed in engineering and marketing roles for companies involved in the embedded computer and application markets, designing and selling equipment primarily for industrial applications. Mr. Fischer has a Bachelors of Science in Engineering from the University of Minnesota, Minneapolis and a Masters of Science in Engineering from the University of California, Berkeley.