
In any Outage Management process one of the first challenges is to identify where the cause of the fault is located. Knowing “Where”, will then allow you to identify “What” the nature and cause of the fault is, “How” to manage the restoration process, and then “When” it will be restored.
Improving your accuracy and response times in each of these areas will support the common goals of all utilities in this area; Reduced interruption duration; Improved resource and asset management; Improved Stakeholder/Customer satisfaction. These goals and the resultant outcomes at an Operational level will (or should!) be prioritised in accordance with the core Strategic objectives of the business.
There probably isn’t enough room here to address all of the components of modern Outage Management but we will look at the technological changes and analysis tools available now to dramatically improve the speed with which you can solve the “Where” component. We now call these Outage Indicators.
Outage Indicators
Outage Indicators are the various push inputs used to expedite the identification of where an Outage has occurred, both as to the footprint of the outage, and specific point of failure.
Traditionally this has amounted to using two components:
Depending on the level and accuracy of your electrical connectivity, various grouping up processes have been automated to identify the likely upstream section or isolation/protection device, but the accuracy of this is dictated by the sample size (number of calls you can actually answer and therefore capture), connectivity, quality of the customer phone number to meter lookup, and interpretation capability of the system operators.
More often than not, unless a specific customer notification of the fault location has been received, crews still end up having to “drive the line” which is the most expensive and inefficient approach to identifying “Where”.
All other items being the same, it naturally follows that being able to shrink the size of the search area within the overall Outage Footprint will result in faster identification and eventual restoration. It is in this “Where” area of the puzzle that the use of Outage Indicators can provide significant benefits.
As a consequence of technology developments and the experiences gained above, a new way to look at solving the ‘Where" problem is available. In the same way you can improve the accuracy of a positional fix (GPS) by having multiple sources (satellites), so the same is true of being able to identify “Where” by having multiple Outage Indicator Sources.
Network Monitoring - below the breaker is now becoming cheaper and more viable, both from the hardware perspective and the control system management of large amounts of data, automated sectionalizing provides fast isolation and restoration of non faulted customers and can be valuable in certain circumstances, although the business case is still difficult based upon reliability alone. When the sectionalizers activate this will advise the SCADA system which in turn will provide valuable information to the OMS as to the “sectionalised” areas that have been isolated and so the clearly defined boundaries of the faulted area within which the actual event has occurred. This however can still be a large area.
Customer calls – These will continue to be an important part of the analysis as they not only provide a quantitative measure, but they are the only Outage Indicator which can provide qualitative data, e.g. “I saw a truck run through the pole outside my house and I’m at...”. We need to make every possible effort to ensure that these “golden ticket” callers can get through to an operator, and that Customer Calls are not just treated as a quantitative measure.
AMR – Most AMR meters now have the facility to forward power on and power off event notifications, which can be used in a similar manner to Customer Calls by cross referencing the meter ID to the customer premise and associated Feeder connectivity. Meters using Power line carrier type technologies will obviously have difficulty delivering that event notification if they are electrically disconnected from their upstream data consolidator; however they are excellent for confirming power is back on. Although AMR has had a tough time with cost justification a number of utilities who have chosen not to roll out AMR for meter reading, are using the technology in strategic positions throughout the network and it represents a low cost way of placing monitoring devices right at the end of radial feeders or associated laterals for power On/Off confirmations.
Fault Indicators – Like AMR these devices are a low cost way to place monitoring out onto either different sides of an automatic device (e.g. Sectionalizer), or on specific sections. In some cases these units have both visual and event notification (e.g. Fisher Pierce). With a visual indicator e.g. LED, it is easy for a lineman to see the state of the section without having to get out of the vehicle. These have been particularly useful in situations where a section or sections of the Feeder are away from the road, e.g. crossing farmland.
Telco Call Data – This is perhaps one of the most exciting developments and enhancements to the already proven Customer Call counting and grouping process. In this instance a call record is passed from the Telco via IP the instant a call is placed from the customer to the 800 fault number. In many cases the utility can receive the phone number of the calling party (to the 800 fault line number) before the caller even hears ringing at their end! This has the profound advantage of the utility not even having to receive the call or wait for the call to be connected to the utility call center before the call record can be linked to a customer record and connectivity and used as part of the “Where” determination.
Short Circuit Analysis – This relies on measuring devices on the Feeder to capture the cycles pre and post event, generally at the Sub station. This real-time information is then applied to the information held in the network connectivity and asset system e.g. GIS or network planning tool, using the known lengths, ratings and types of conductor to mathematically determine the distance from the measurement point (Feeder breaker). Obviously this requires good up-to-date connectivity and asset information about the Feeder but in many cases the level of accuracy is inside visual identification range in adverse conditions i.e. 150-200 meters. This calculation needs to be looked at in parallel with other Outage Indicators as there may be situations where laterals may cause the calculation to identify 2 or more possible locations. This methodology also requires measurement hardware at the substation which can support peak load measurements which may be normally outside the range of specified equipment for routine monitoring of load.
Rules Based Learning and Analysis (RBLA) – Where we previously had only two or perhaps three simple inputs (e.g. SCADA and Customer Calls) it was relatively easy to consolidate the data and make decisions on likely point of failure using simple grouping algorithms and “operator art”. However as additional tools such as short circuit analysis are employed in real-time and there are lots of inputs, it is becoming increasingly necessary to look to rules based systems often with complex algorithms to analyse the data available to the system. This includes such items as historic data about faults on this feeder, realtime weather and in particular, lightning strike data, and of course real-time connectivity, to provide the operator either with a point at which they can send a crew with a very high degree of confidence, if not specific accuracy, e.g. 95% probability within 200 meters.
Conclusions
There are now a large number of options for utilities to use additional Outage Indicators to fine tune their analysis of where fault locations are and see significant improvements in outage duration, resource utilisation, and efficient management of their assets to prove their competence in maintaining an essential service.
This type of analysis also presents additional benefits such when the truck goes to the point in the network “Where” it is likely the failure occurred they can ensure they have materials on board e.g. Cable type, that will allow them to immediately deal with the problem, rather than having to return to stores and thereby extending the outage duration.
The costs to use these types of facilities are often in the hundreds of dollars as opposed to the tens of thousands, and perhaps it’s worthwhile considering quickly the value of saving even 10-15 minutes per outage by being able to identify “Where” the problems are and more efficiently deploying resources?
Better accuracy and improved speed getting to “Where” will also place you in a much better position to then determine “What”, “How” and “When”.
About the Author
Andrew Thompson is CEO and President of TVD Inc., a world leader in the area of Trouble Call, Outage, Operations and Works Management. TVD have clients and partners in regulated and deregulated markets globally.

These 4 stages, and the numerous inputs to each, represent the essence of Outage Management.
Improving your accuracy and response times in each of these areas will support the common goals of all utilities in this area; Reduced interruption duration; Improved resource and asset management; Improved Stakeholder/Customer satisfaction. These goals and the resultant outcomes at an Operational level will (or should!) be prioritised in accordance with the core Strategic objectives of the business.
There probably isn’t enough room here to address all of the components of modern Outage Management but we will look at the technological changes and analysis tools available now to dramatically improve the speed with which you can solve the “Where” component. We now call these Outage Indicators.
Outage Indicators
Outage Indicators are the various push inputs used to expedite the identification of where an Outage has occurred, both as to the footprint of the outage, and specific point of failure.
Traditionally this has amounted to using two components:
- Network Monitoring – Typically this has meant SCADA and a related Feeder Breaker trip at the Substation. This provides a very coarse indicator of a faulted section i.e. “Somewhere on this Feeder”. In the case of short Feeders (<1-2km) this may represent a sufficiently small footprint to allow for visual identification of the actual location by crews (or customers), however it is still inefficient and a short Feeder may indicate high load/customer density where any delay in identification and therefore restoration will have a proportionally greater impact on time based performance indices, e.g. SAIFI, than a lower density larger Feeder.
- Customer Calls – “Human Fault Detectors”, nothing is more certain than when supply is interrupted you will be flooded by an avalanche of unhappy customers phoning in. Without exception and particularly in LV faults, customer calls when related to their meter points and associated upstream connectivity have represented the widest used method of determining the footprint of the problem, and so the boundary within which to look for the actual “Where” location.
Depending on the level and accuracy of your electrical connectivity, various grouping up processes have been automated to identify the likely upstream section or isolation/protection device, but the accuracy of this is dictated by the sample size (number of calls you can actually answer and therefore capture), connectivity, quality of the customer phone number to meter lookup, and interpretation capability of the system operators.
More often than not, unless a specific customer notification of the fault location has been received, crews still end up having to “drive the line” which is the most expensive and inefficient approach to identifying “Where”.
All other items being the same, it naturally follows that being able to shrink the size of the search area within the overall Outage Footprint will result in faster identification and eventual restoration. It is in this “Where” area of the puzzle that the use of Outage Indicators can provide significant benefits.
As a consequence of technology developments and the experiences gained above, a new way to look at solving the ‘Where" problem is available. In the same way you can improve the accuracy of a positional fix (GPS) by having multiple sources (satellites), so the same is true of being able to identify “Where” by having multiple Outage Indicator Sources.
Network Monitoring - below the breaker is now becoming cheaper and more viable, both from the hardware perspective and the control system management of large amounts of data, automated sectionalizing provides fast isolation and restoration of non faulted customers and can be valuable in certain circumstances, although the business case is still difficult based upon reliability alone. When the sectionalizers activate this will advise the SCADA system which in turn will provide valuable information to the OMS as to the “sectionalised” areas that have been isolated and so the clearly defined boundaries of the faulted area within which the actual event has occurred. This however can still be a large area.
Customer calls – These will continue to be an important part of the analysis as they not only provide a quantitative measure, but they are the only Outage Indicator which can provide qualitative data, e.g. “I saw a truck run through the pole outside my house and I’m at...”. We need to make every possible effort to ensure that these “golden ticket” callers can get through to an operator, and that Customer Calls are not just treated as a quantitative measure.
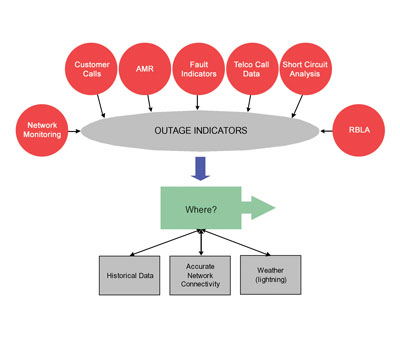
The following is a list of the Outage Indicators which Utilities now have access to, to assist in shrinking the search area and pinpoint the location of a fault:
- Network Monitoring (Feeder and lower)
- Customer Calls
- AMR
- Fault Indicators
- Telco call data
- Short Circuit Analysis
- Rules Based Learning and Analysis (RBLA)
AMR – Most AMR meters now have the facility to forward power on and power off event notifications, which can be used in a similar manner to Customer Calls by cross referencing the meter ID to the customer premise and associated Feeder connectivity. Meters using Power line carrier type technologies will obviously have difficulty delivering that event notification if they are electrically disconnected from their upstream data consolidator; however they are excellent for confirming power is back on. Although AMR has had a tough time with cost justification a number of utilities who have chosen not to roll out AMR for meter reading, are using the technology in strategic positions throughout the network and it represents a low cost way of placing monitoring devices right at the end of radial feeders or associated laterals for power On/Off confirmations.
Fault Indicators – Like AMR these devices are a low cost way to place monitoring out onto either different sides of an automatic device (e.g. Sectionalizer), or on specific sections. In some cases these units have both visual and event notification (e.g. Fisher Pierce). With a visual indicator e.g. LED, it is easy for a lineman to see the state of the section without having to get out of the vehicle. These have been particularly useful in situations where a section or sections of the Feeder are away from the road, e.g. crossing farmland.
Telco Call Data – This is perhaps one of the most exciting developments and enhancements to the already proven Customer Call counting and grouping process. In this instance a call record is passed from the Telco via IP the instant a call is placed from the customer to the 800 fault number. In many cases the utility can receive the phone number of the calling party (to the 800 fault line number) before the caller even hears ringing at their end! This has the profound advantage of the utility not even having to receive the call or wait for the call to be connected to the utility call center before the call record can be linked to a customer record and connectivity and used as part of the “Where” determination.
Short Circuit Analysis – This relies on measuring devices on the Feeder to capture the cycles pre and post event, generally at the Sub station. This real-time information is then applied to the information held in the network connectivity and asset system e.g. GIS or network planning tool, using the known lengths, ratings and types of conductor to mathematically determine the distance from the measurement point (Feeder breaker). Obviously this requires good up-to-date connectivity and asset information about the Feeder but in many cases the level of accuracy is inside visual identification range in adverse conditions i.e. 150-200 meters. This calculation needs to be looked at in parallel with other Outage Indicators as there may be situations where laterals may cause the calculation to identify 2 or more possible locations. This methodology also requires measurement hardware at the substation which can support peak load measurements which may be normally outside the range of specified equipment for routine monitoring of load.
Rules Based Learning and Analysis (RBLA) – Where we previously had only two or perhaps three simple inputs (e.g. SCADA and Customer Calls) it was relatively easy to consolidate the data and make decisions on likely point of failure using simple grouping algorithms and “operator art”. However as additional tools such as short circuit analysis are employed in real-time and there are lots of inputs, it is becoming increasingly necessary to look to rules based systems often with complex algorithms to analyse the data available to the system. This includes such items as historic data about faults on this feeder, realtime weather and in particular, lightning strike data, and of course real-time connectivity, to provide the operator either with a point at which they can send a crew with a very high degree of confidence, if not specific accuracy, e.g. 95% probability within 200 meters.
Conclusions
There are now a large number of options for utilities to use additional Outage Indicators to fine tune their analysis of where fault locations are and see significant improvements in outage duration, resource utilisation, and efficient management of their assets to prove their competence in maintaining an essential service.
This type of analysis also presents additional benefits such when the truck goes to the point in the network “Where” it is likely the failure occurred they can ensure they have materials on board e.g. Cable type, that will allow them to immediately deal with the problem, rather than having to return to stores and thereby extending the outage duration.
The costs to use these types of facilities are often in the hundreds of dollars as opposed to the tens of thousands, and perhaps it’s worthwhile considering quickly the value of saving even 10-15 minutes per outage by being able to identify “Where” the problems are and more efficiently deploying resources?
Better accuracy and improved speed getting to “Where” will also place you in a much better position to then determine “What”, “How” and “When”.
About the Author
Andrew Thompson is CEO and President of TVD Inc., a world leader in the area of Trouble Call, Outage, Operations and Works Management. TVD have clients and partners in regulated and deregulated markets globally.