On August 3, 2015, the U.S. Environmental Protection Agency (EPA) announced the finalized language of their Clean Power Plan (CPP). Originally proposed in June 2014, the EPA fielded over four million comments during the several months of the open-comment period set for this rule. The result of this effort is a final rule that still aims to reduce power sector carbon emissions by curtailing the pollution from existing generating units.
What has changed from the proposed to the final rule? What are the immediate implications for stakeholders? What are the next steps in preparing for the CPP’s implementation? These are important questions that will define the next chapter of the CPP. This article will explore some of the high-level changes within the final rule. Then we’ll look at how the final rules may affect energy stakeholders.
Timeline
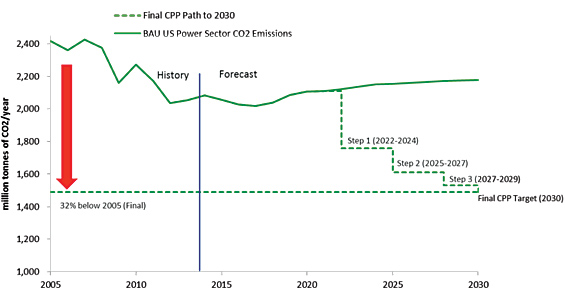
Figure 1 shows how forecasted emissions in 2030 differ with and without the final CPP. The eight-year interim period from 2022 through 2029 is separated into three steps, 2022 to 2024, 2025 to 2027 and 2028 to 2029. Each time period is associated with a specific interim carbon dioxide emission performance rate.
Figure 1: Emission Reductions by 2030 under the Final Clean Power Plan
Building Blocks
Through the Clean Power Plan, EPA developed emission reduction targets for each state based on current emission levels and potential reduction capabilities determined through EPA’s best system of emissions reductions (BSER) for carbon dioxide. The final BSER used for the CPP is based on three building blocks for emission reduction compliance: (1) heat rate improvements from existing coal-fired facilities, (2) increased dispatch of natural gas combined cycle generation, and (3) increased generation from zero-carbon renewable sources such as PV and wind.
Figure 2: BSER Building Blocks of the Final Clean Power Rule
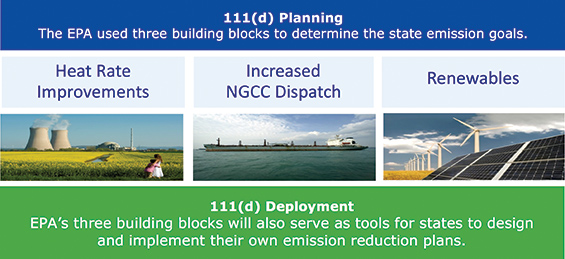
Note that nuclear was removed from the third building block, which we discuss further below. And according to the EPA, the previous fourth building block of energy efficiency was removed to circumvent some legal challenges to the rule.
Compliance Targets
Another change between the proposed and the final 111(d) rule has been the modified carbon dioxide emission reduction targets. These new compliance targets were calculated by using these refined building blocks and regional emissions rates to create national emission targets for fossil steam and natural gas generation.1 State specific compliance targets took these national standards and used each state’s generation mix between fossil and NG steam to derive a compliance target.
Figure 3: Proposed and Final Compliance Targets by State
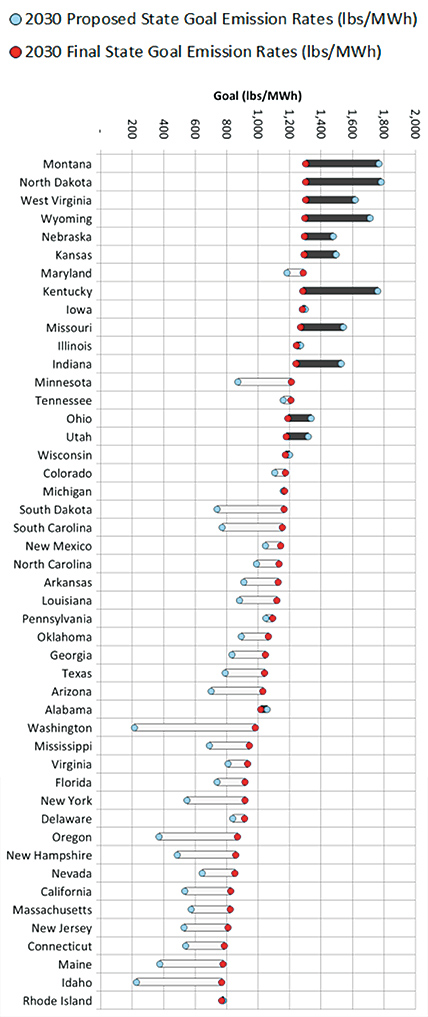
Figure 3 illustrates the emission rate goals (lbs/MWh) for every state, but also which states had the largest change in their goals between the proposed and finalized rule. The blue dot indicates the emission rate target initially proposed, the red dot displays the finalized emission rate target. Dark colored bars indicate states with stricter finalized goals when compared to the proposed rule. Clear bars indicate states that have more lenient goals when making the same comparison.
Montana, for example, has the most lenient finalized target carbon dioxide emission rate. But compared to the proposed CPP rule, it is much stricter now than originally proposed. Washington, on the other hand, had a very strict goal in the proposed rule, but now has a much higher lbs/MWh target for compliance, making it easier to reach.
What will it mean for stakeholders?
Stakeholders in Fossil Fuel Heavy States
As illustrated in figure 3, the final rule imposes stricter carbon emission reduction targets on several states. States such as New England, Kansas, Wyoming and West Virginia have been allowed the highest emission rates. At the same time, the final carbon dioxide reductions mandated from those still represent a dramatic drop in comparison to what the 111(d) rule had originally proposed. Many of those states rely heavily on fossil fuel generation, and are pursuing their lawsuit against the EPA.2
Nuclear Stakeholders
In addition, nuclear generation is not counted anymore as part of the baseline, and has been removed as one of the BSER building blocks. This directly impacts five under construction nuclear power plants: Summer 2 and 3 (South Carolina); Vogtle 3 and 4 (Georgia); and Watts Bar 2 (Tennessee).3 Each of these plants can now be counted toward state compliance, which makes a big difference for the states each of these plants will reside.
Cap and Trade Stakeholders
Finally, the fact that the EPA provided mass-based as well as rate-based goals, states currently engaged in carbon emissions trading can easily translate their framework towards their compliance. The implications of this is that organizations like the Regional Greenhouse Gas Initiative (RGGI) in the Northeastern part of the US will serve as a functional example of how a carbon dioxide trading market between states can be established. Several states may plan to join the already established RGGI framework, or organize their own.4
Preparation: What should States be doing now?
State plans are due to EPA in September 2016, with a potential extension of up to two years, if requested by individual states. As discussed above, the compliance period begins in 2022 instead of 2020, as proposed in the initial plan.
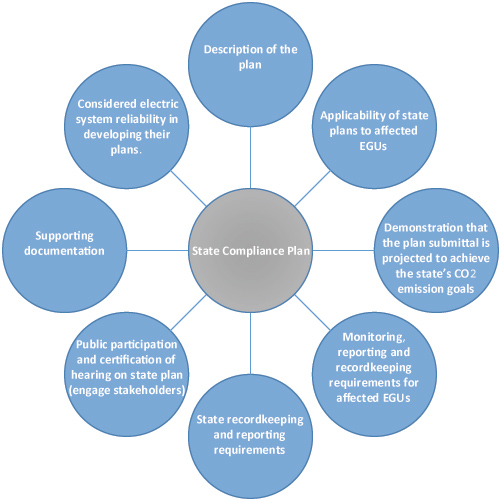
If the states don’t meet the deadline to prepare the 111(d) state compliance plans, EPA will develop a Federal Implementation Plan. The following figure shows the basic components of a 111(d) state compliance plan as stated in the final rule.
Figure 4: Components of 111(d) State Compliance Plan
Pick the Low Hanging Fruit: Energy Efficiency Opportunities
The final CPP rule also includes a Clean Energy Incentive Program (CEIP) to encourage early action by states. The CEIP provides opportunities for investments in renewable energy (RE) and demand-side energy efficiency (EE) implemented in low-income communities that deliver results in 2020 and/or 2021. States meeting the requirements set forth in the CEIP will be eligible to receive matching allowances from EPA that equate to “a total for all states that represents the equivalent of 300 million short tons of carbon dioxide emissions.”5
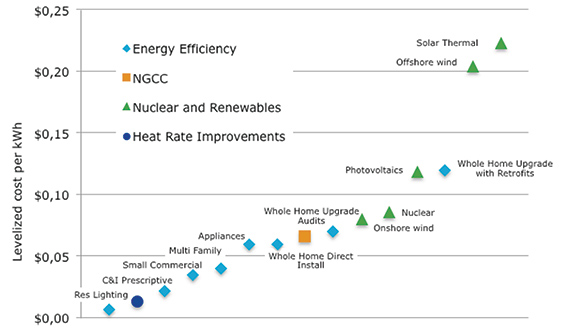
Energy efficiency is not only the quickest path towards compliance; it is likely to be the most cost-effective as well. In figure 5, we compare typical costs of different types of energy efficiency programs with those of other compliance options. Historically, successful energy efficiency programs such as residential lighting or commercial and industrial, have the lowest lifetime costs per kWh. For states and utilities with little energy efficiency program experience, initial costs to develop new programs will likely be higher than what is shown in the figure. However, experience from other jurisdictions suggests that program costs decrease after initial development. Nationally, a typical energy efficiency program costs roughly $0.16/kWh for the first year, but only $0.02/kWh over the program lifetime.6
Figure 5: Cost per kWh for CPP Compliance Mechanisms 7,8,9
Conclusion
There are clear winners and losers from the finalized rule, with nuclear stakeholders and trading systems like RGGI benefiting from the finalized language. States with heavy fossil-fuel generation have emission targets more stringent than originally proposed. Although the CPP has been finalized, it is not out of the woods quite yet. Multiple states still have pending legal challenges against the rule, and as the 2016 presidential election unfolds, there are several scenarios that could halt its implementation. This includes a judicial ruling that the EPA overstepped its authority within the CAA, Congress passing a new law that adjusts the scope of the CAA, or a new president nominating a new EPA Administrator that takes measures to water-down or reverse the current rule. However, as of right now, this policy has been finalized and announced.
Therefore, states are on the clock to meet compliance timeframes, with implementation plans due in 2018, and first reduction targets met by 2022. As evidenced in figure 5, energy efficiency is a cost-effective means to help states meet their compliance targets. DNV GL has extensive experience in both the implementation and evaluation of energy efficiency program portfolios. We are well prepared to help utilities invest in and harvest this low hanging fruit. As a result, states should be thinking about how to move in this direction to capitalize on early opportunities and CEIP carbon credits towards meeting their compliance targets.
About the Authors
 Jason Symonds is a consultant in DNV GL’s Policy Advisory and Research practice, with experience helping utility clients perform M&V evaluations on both residential and non-residential energy efficiency programs. This includes developing energy efficiency potential models, as well as performing program attribution methodology, and incorporating Net-to-Gross Ratios into impact analysis. He has developed and implemented surveys for Transportation and Renewable Energy program evaluations, collecting primary data from program participants and vendors.
 Suman Gautam, PhD, is a consultant in DNV GL’s Policy Advisory and Research Practice. He has experience in managing large and complex utility data sets and estimating energy program and policy impacts by applying appropriate statistical and forecasting models. Suman serves as lead analyst on quantitative and qualitative studies which focus on behavioral energy efficiency programs and understanding the relationship between weather and electricity usage. He joined DNV GL in 2014 after receiving a PhD degree in Energy Management and Policy from Pennsylvania State University.
 Kristina Kelly, a senior consultant in DNV GL’s Policy, Advisory, and Research team, has been working at DNV GL since June 2008 and has ten years of energy research and analysis experience. In her current position, Ms. Kelly has managed a number of electric and gas efficiency potential studies and evaluations of the energy and carbon savings attributable to the ENERGY STAR program and clean energy policy support programs funded by the State Energy Program. Ms. Kelly also oversaw the recent analysis of carbon and labor impacts associated with ARRA-funded energy programs.
 Bert Taube is a Principal Consultant in DNV GL’s Policy Advisory and Research practice. He is focused on project developments related to energy efficiency programs, utility load and financial solutions as well as data technology. Bert has spent more than 20 years creating and leading projects for high-voltage power transmission and electric transportation networks as well as Big Data analytics and automation software to serve mission-critical infrastructures.
References
1 Pg.4 http://www.epa.gov/airquality/cpp/fs-cpp-key-changes.pdf
2 http://www.latimes.com/business/la-fi-epa-lawsuit-20140805-story.html
3 http://www.nei.org/Knowledge-Center/Nuclear-Statistics/US-Nuclear-Power-Plants
4 http://www.utilitydive.com/news/clean-power-plan-compliance-options-coulddrive-states-to-join-rggi/403613/
5 Page 43, http://www.epa.gov/airquality/cpp/cpp-final-rule.pdf
6 Energy Efficiency Costs: LBNL, March 2014. “The Program Administrator Cost of Saved Energy for Utility
Customer-Funded Energy Efficiency Programs”. http://emp.lbl.gov/sites/all/files/lbnl-6595e.pdf
7 Energy Efficiency Costs: LBNL, March 2014. “The Program Administrator Cost of Saved Energy for Utility
Customer-Funded Energy Efficiency Programs”. http://emp.lbl.gov/sites/all/files/lbnl-6595e.pdf
8 Renewable, Nuclear, and NGCC Costs: EIA, “ANNUAL ENERGY OUTLOOK 2014 :
Levelized Cost and Levelized Avoided cost of New Generation Resources in the Annual Outlook 2014 Table 1”
4/17/2014 accessed on 3/29/2015 from http://www.eia.gov/forecasts/aeo/electricity_generation.cfm
9 Heat Rate Improvement Costs: EPA, “EPA v5.13 Base Case Documentation Supplement to
Support EPA’s Proposed Carbon Pollution Guidelines for Existing Electric Generating Units”.
http://www.epa.gov/airmarkets/powersectormodeling/docs/EPA%20Base%20Case%20v5%2013%20Documentation%20Supplement%20for%20CPP_6_12_14.pdf